Free Profitable Forex Newsletter
Hey! This is Philip with this week's trade idea of the Free Profitable Forex Newsletter!
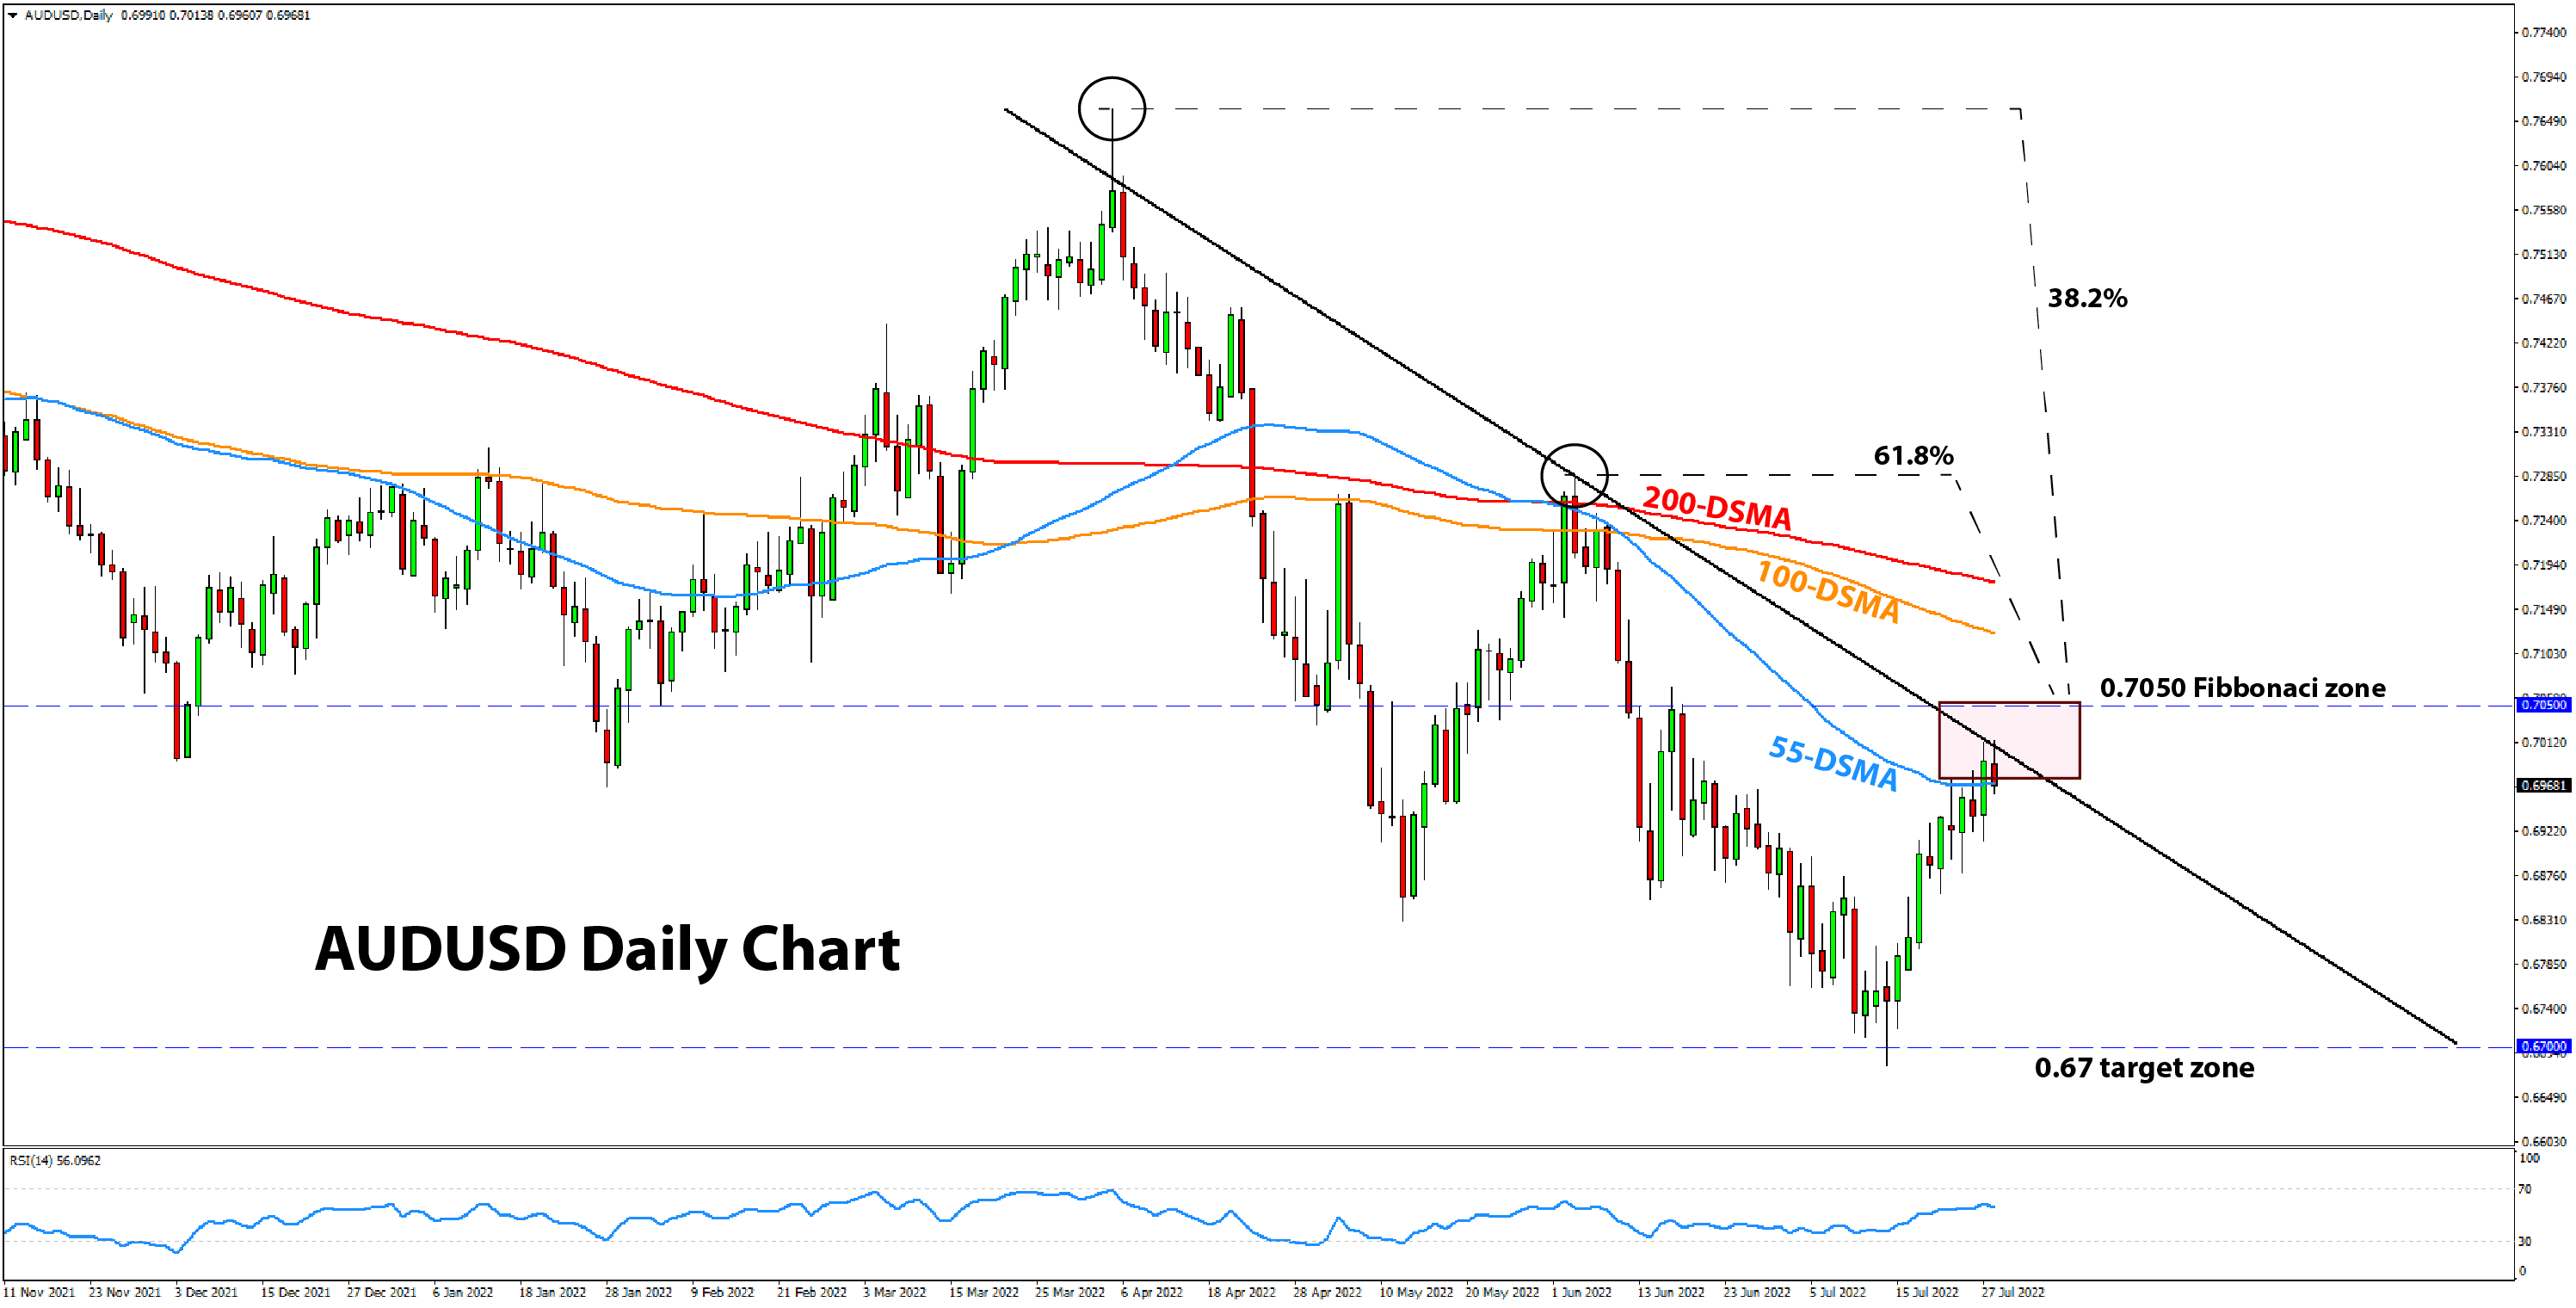
AUDUSD continued to correct higher this week and even reached 0.70 yesterday and today, where it was rejected on both occasions. The pair has now fallen closer to 0.6950, perhaps indicating that this could be the top of this retracement leg.
0.70 is an important technical zone in AUDUSD, and with the predominant trend being down, it makes sense to start looking for bearish opportunities around current levels. The bearish trend on AUDUSD is in line with the broad bullish fundamentals of the US dollar, and the longer-term charts confirm the bearish picture, with both the
weekly and daily timeframes clearly showing the falling trend.
In the current context, however, the more important resistance is likely around the 0.7050 zone. This is now a Fibonnaci confluence resistance zone, with the 38.% and 61.8 retracements concurring here. If AUDUSD extends the retracement higher and reaches this 0.7050 area, some strong reaction is likely. Such a scenario is likely to be an attractive opportunity to go short.
Watching the 4H chart for clues
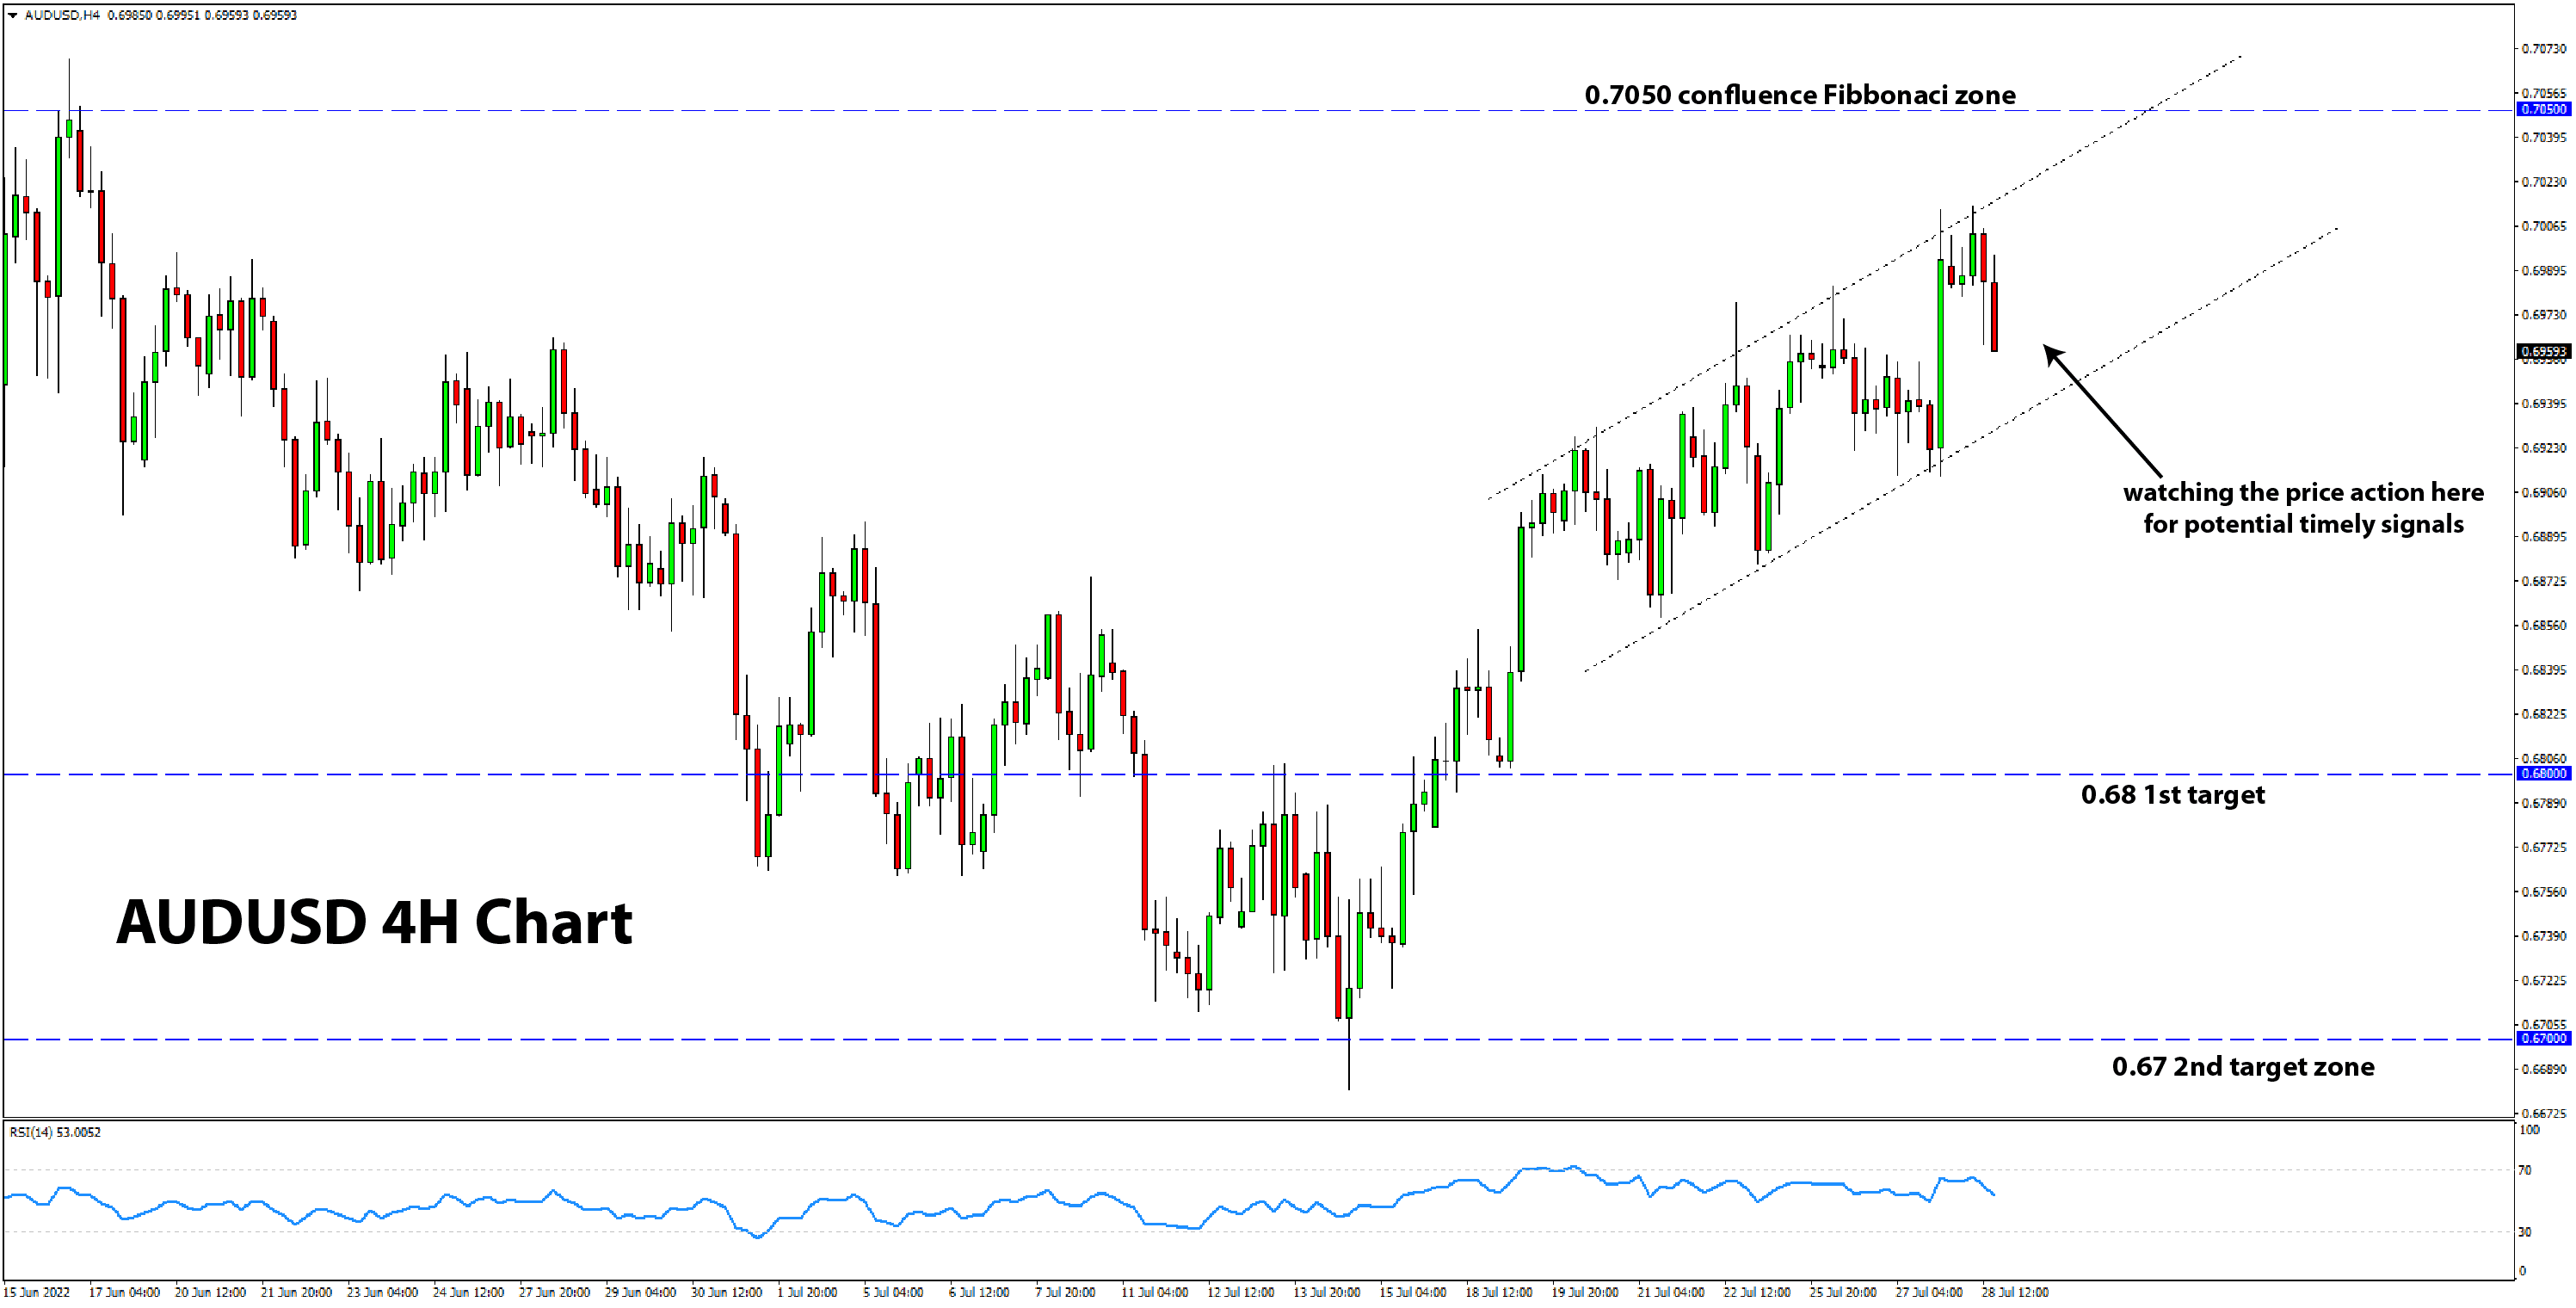
Looking at the 4H chart, we can see that the last 8-9 days of the retracement up are well-defined inside of two parallel trendlines. We can use this formation for signals when the retracement has definitely ended and when the bearish trend may resume. Naturally, a bearish break below the support line here would provide stronger conviction that this retracement has indeed. This could be used as a signal to enter a short trade, even if, say, AUDUSD
doesn’t first reach the above-mentioned 0.7050 Fibonacci area.
However, in case AUDUSD continues to grind higher and reaches the 0.7050 area, then we can look for bearish setups there. In this scenario, looking to enter short closer to the upper trendline of the 4H chart retracement channel would make sense.
Entry:
- Wait for AUDUSD to reach the 0.7050 Fibonacci zone; then look for a bearish entry signal there
- Wait for a bearish break of the retracement channel on the 4H chart; then enter short when a bearish breakout is confirmed
Stop loss:
- Above the high of the bearish setup; certainly above 0.7050 but could be higher, the 100-day (orange) and 200-day (red) MAs are near the 0.71 zone
- Above the breakout point on the chart or above the most recent swing high on the 4H chart; would likely be above 0.70 at least
Targets:
- 1st TP at 0.68 zone
- 2nd TP at 0.67 zone near the previous lows
- TP beyond: Fresh cycle lows, AUDUSD could fall toward 0.65 if risk aversion intensifies
Trade signals from the past weeks
- July 25, 2022 - Short EURJPY from 139.70, open in progress - currently around +300 pips in the green (trade idea sent July 22)
TOTAL P/L in the past week: N/A
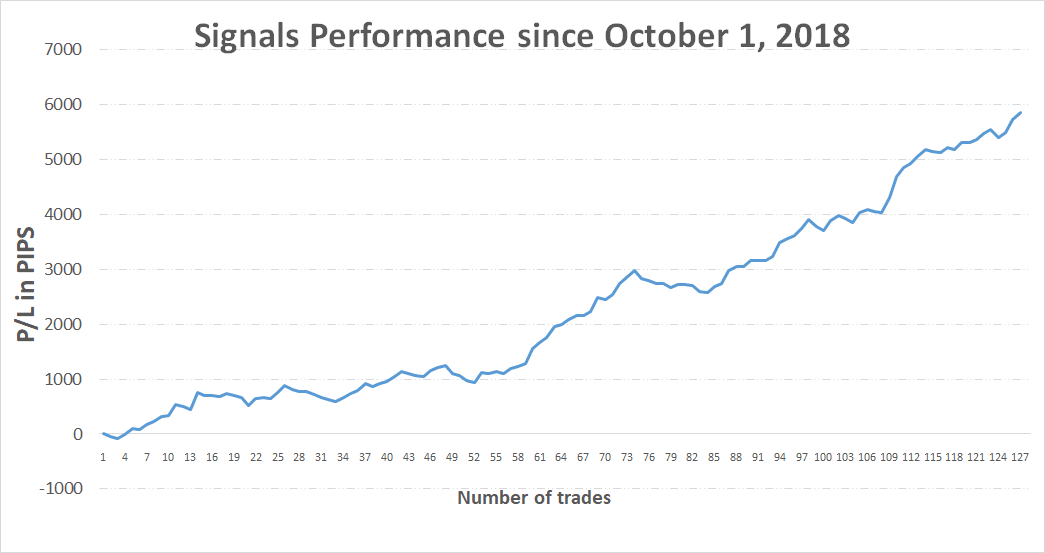
TOTAL: +5805 pips profit since October 1, 2018
If you have any questions or feedback, don't hesitate to reply to this email.
Thank you!
P.S. Email providers such as Gmail and Yahoo! Mail sometimes place messages in different folders or tabs (often in the promotions tab). You can whitelist my email address to ensure that all trade signals I send will end up in your (primary) inbox folder.
High Risk Warning: Please note that foreign exchange and other leveraged trading involves significant risk of loss. It is not suitable for all investors and you should make sure you understand the risks involved, seeking independent advice if necessary.
Any opinions, news, research, predictions, analyses, prices or other information contained in this newsletter is provided as general market commentary and does not constitute investment advice. FX Trading Revolution will not accept liability for any loss or damage including, without limitation, to any loss of profit which may arise directly or indirectly from use of or reliance on such information.
|
|
|
|


