EUR/USD, GBP/USD, USD/JPY
Weekly Forex Analysis
(August 16 - August 23, 2021)
Hey! This is Philip with our new weekly outlook for EUR/USD, GBP/USD, and USD/JPY.
The text below contains only a short preview.
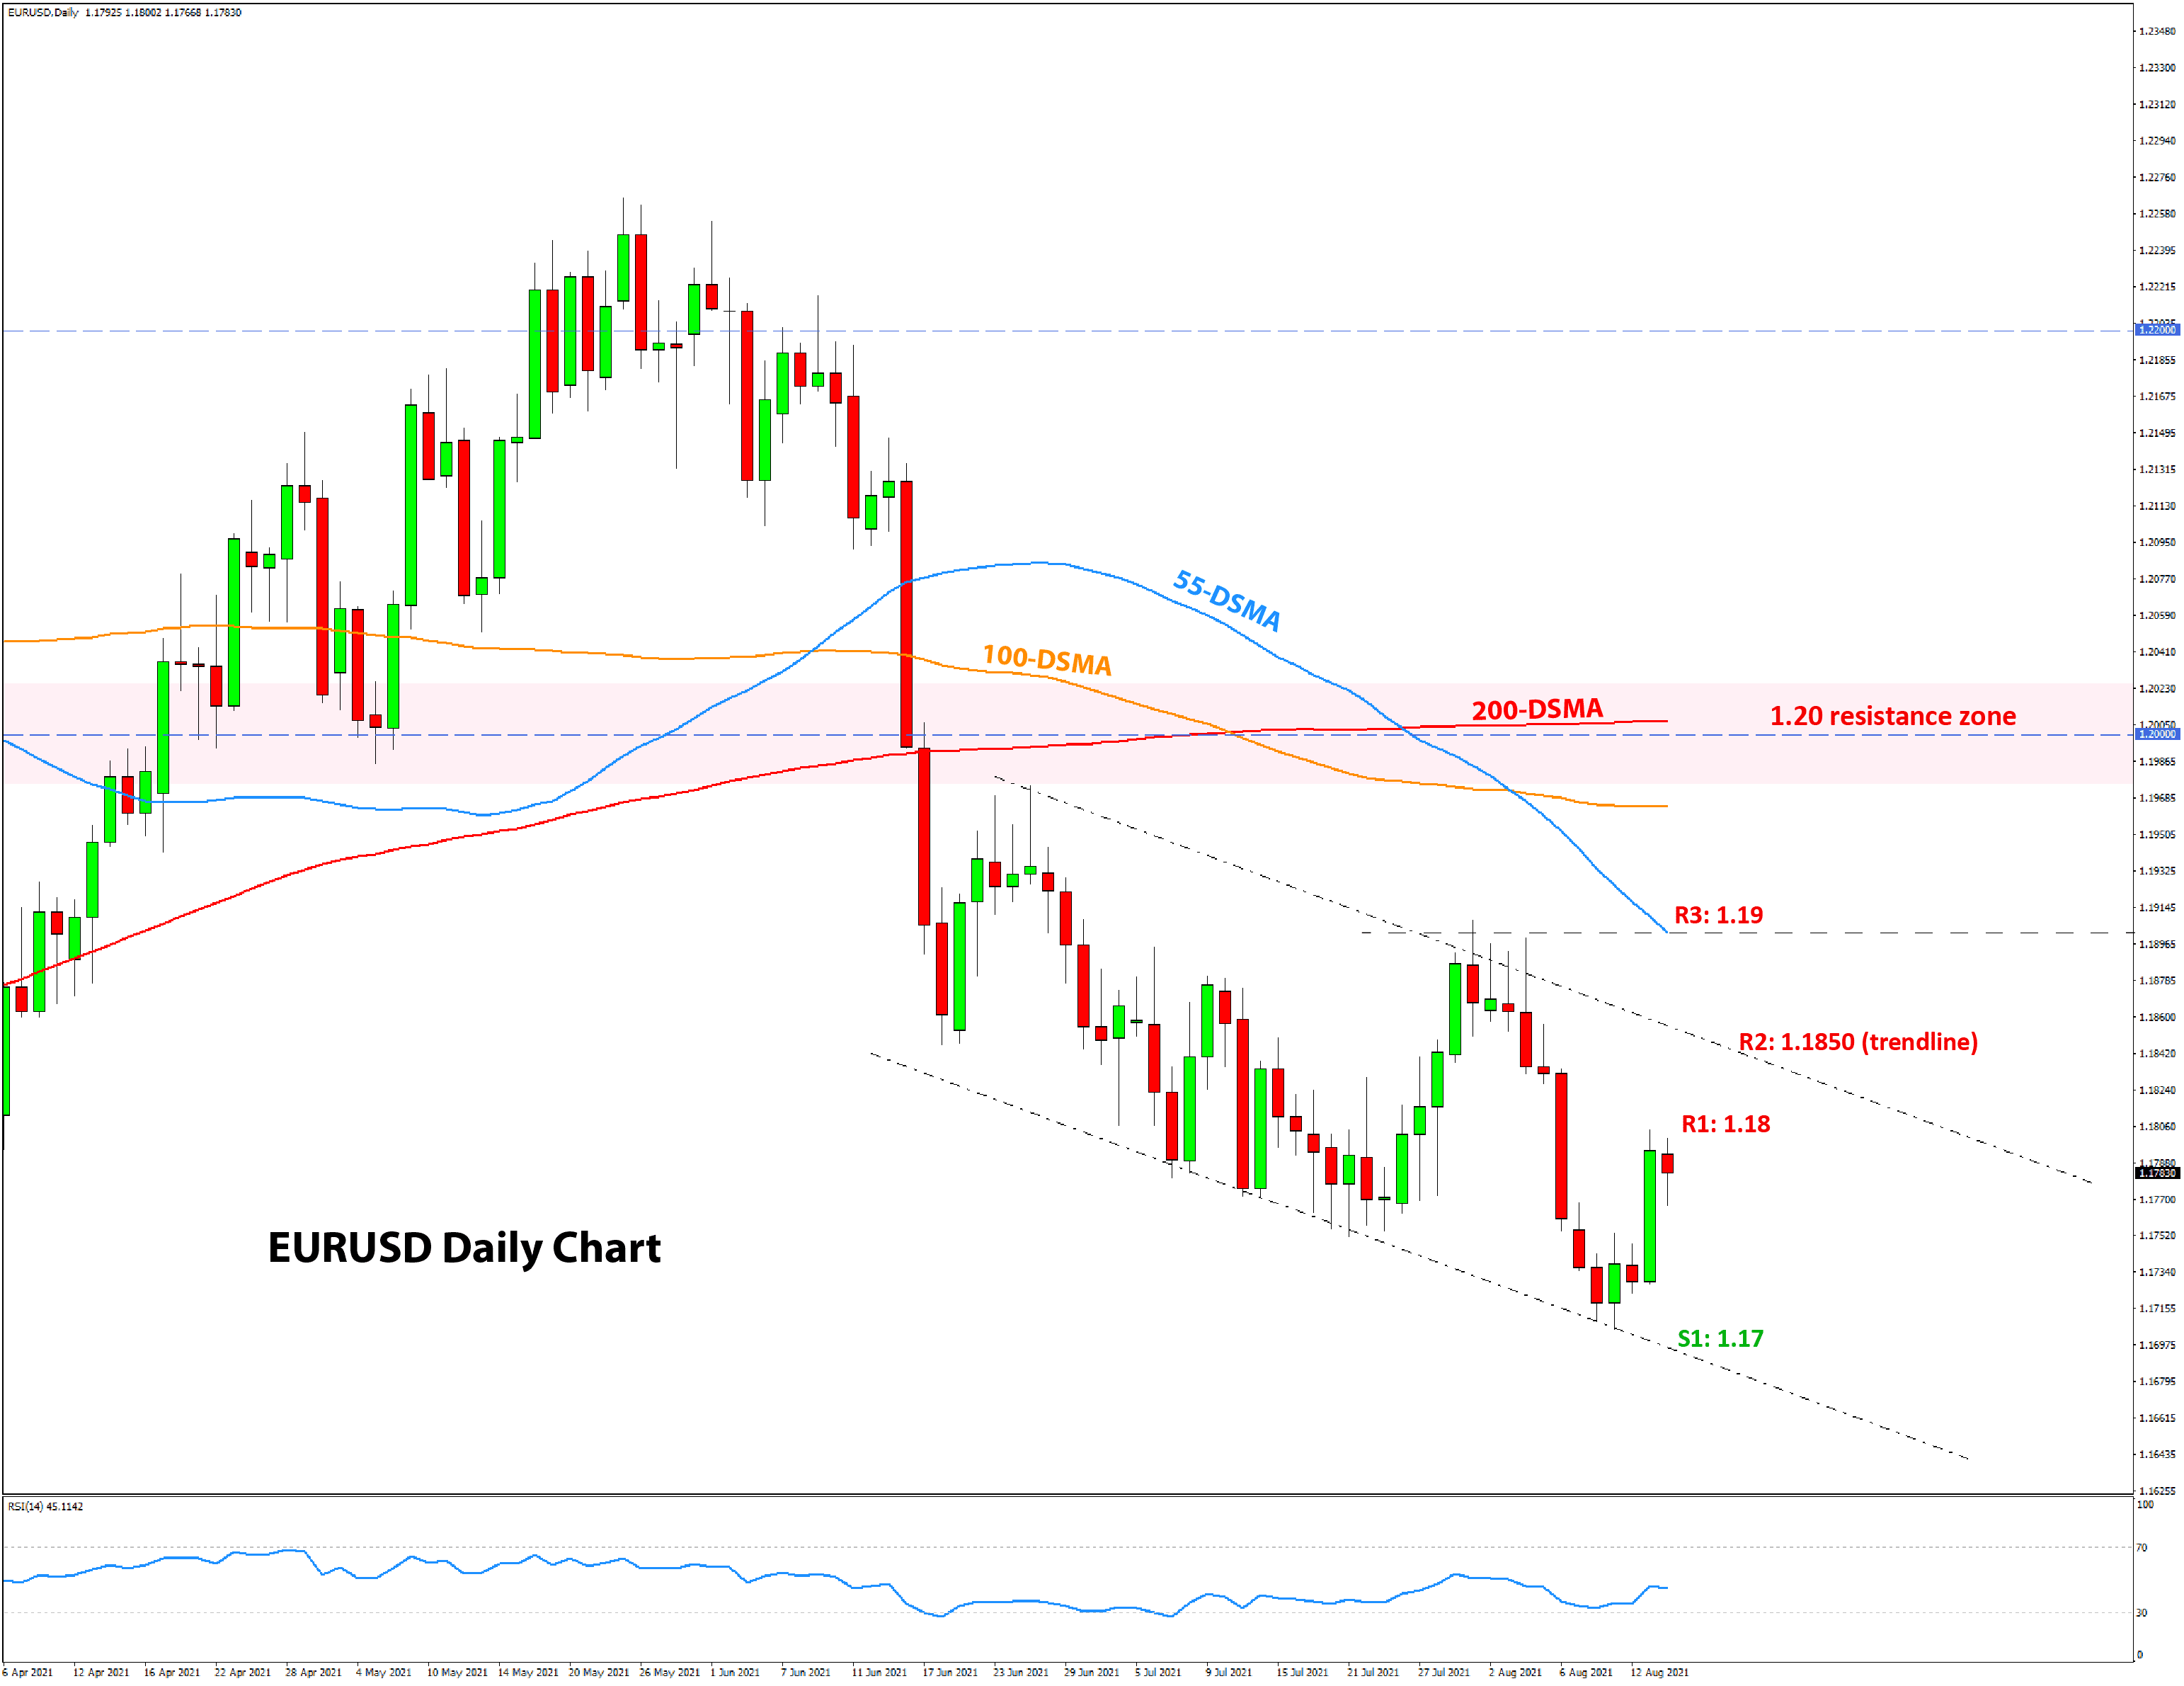
EURUSD Technical Analysis
The rebound late last week took EURUSD almost to the 1.18 level and has since stalled there. The bulls may try to take the price higher, but it’s likely that they will encounter stronger resistance at levels above 1.18. This week we are taking a look at the near-term picture for EURUSD on the daily timeframe. For more on our weekly outlook and the potential head and shoulders pattern, see our analysis from last week here.
The daily chart below shows that a new downtrend has formed on the pair, with a resistance trendline coming in around the 1.1850 level. Above it, the 1.19 price zone is also likely to be resistance based on prior highs and the 55-day moving average (blue line). So, on the daily chart, all three
round number levels are likely to provide resistance, 1.18, then 1.1850, and then 1.19.
To the downside, support is seen at 1.17, near the most recent lows. If the downtrend channel holds, the projection suggests EURUSD can decline below 1.1650 in the next couple of weeks.
If you have any questions or feedback, don't hesitate to reply to this email.
P.S. Email providers such as Gmail and Yahoo! Mail sometimes place messages in different folders or tabs (often in the promotions tab). To ensure that all trade signals I send will end up in your (primary) inbox folder you can add my email address to your contacts list.
High Risk Warning: Please note that foreign exchange and other leveraged trading involves significant risk of loss. It is not suitable for all investors and you should make sure you understand the risks involved, seeking independent advice if necessary.
Any opinions, news, research, predictions, analyses, prices or other information contained in this newsletter is provided as general market commentary and does not constitute investment advice. FX Trading Revolution will not accept liability for any loss or damage including, without limitation, to any loss of profit which may arise directly or indirectly from use of or reliance on such information.
|
|
|
|