Free Profitable Forex Newsletter
Hey! This is Philip with this week's market update of the Free Profitable Forex Newsletter!
Some three months, we discussed our detailed outlook on the price of gold and the precious metal has indeed followed the scenario we outlined back then. For those that haven’t seen it, here is the direct link to that newsletter:
https://archive.aweber.com/awlist5132826/KdrSB/h/Free_Profitable_Forex.htm
The gold price stayed almost precisely inside of the corrective channel, albeit with some undershoots and overshoots, like in late November and January. Gold is now back around the midpoint of this corrective channel, unsure whether it wants to break to the upside or the downside.
On the sidelines this week
Currencies, on the other hand, have recently broken some important ranges, including pairs such as USDJPY, GBPUSD, EURCHF, and EURGBP. In contrast, EURUSD is trading in some kind of consolidation, though it is too attempting to break higher this week and we will see if the bulls are now able to hold levels above 1.22. If they fail, we would assume that EURUSD has remained inside the 1.20 - 1.22 trading range.
Our long USDCHF and NZDUSD trades performed well and both reached their first profit targets for a total of +275 pips. We are happy about our trading results, but it seems it’s time to take a step back from the markets this week again. Large and extended moves have already occurred in some pairs, others have reached important technical areas, and some remain in
consolidation.
With that said, our focus this week is gold, where some interesting tactical setups may occur in the following days and weeks. However, any decline in the price of gold is likely to be an excellent buying opportunity for the long-term.
Gold Near-Term Technicals Turn More Negative
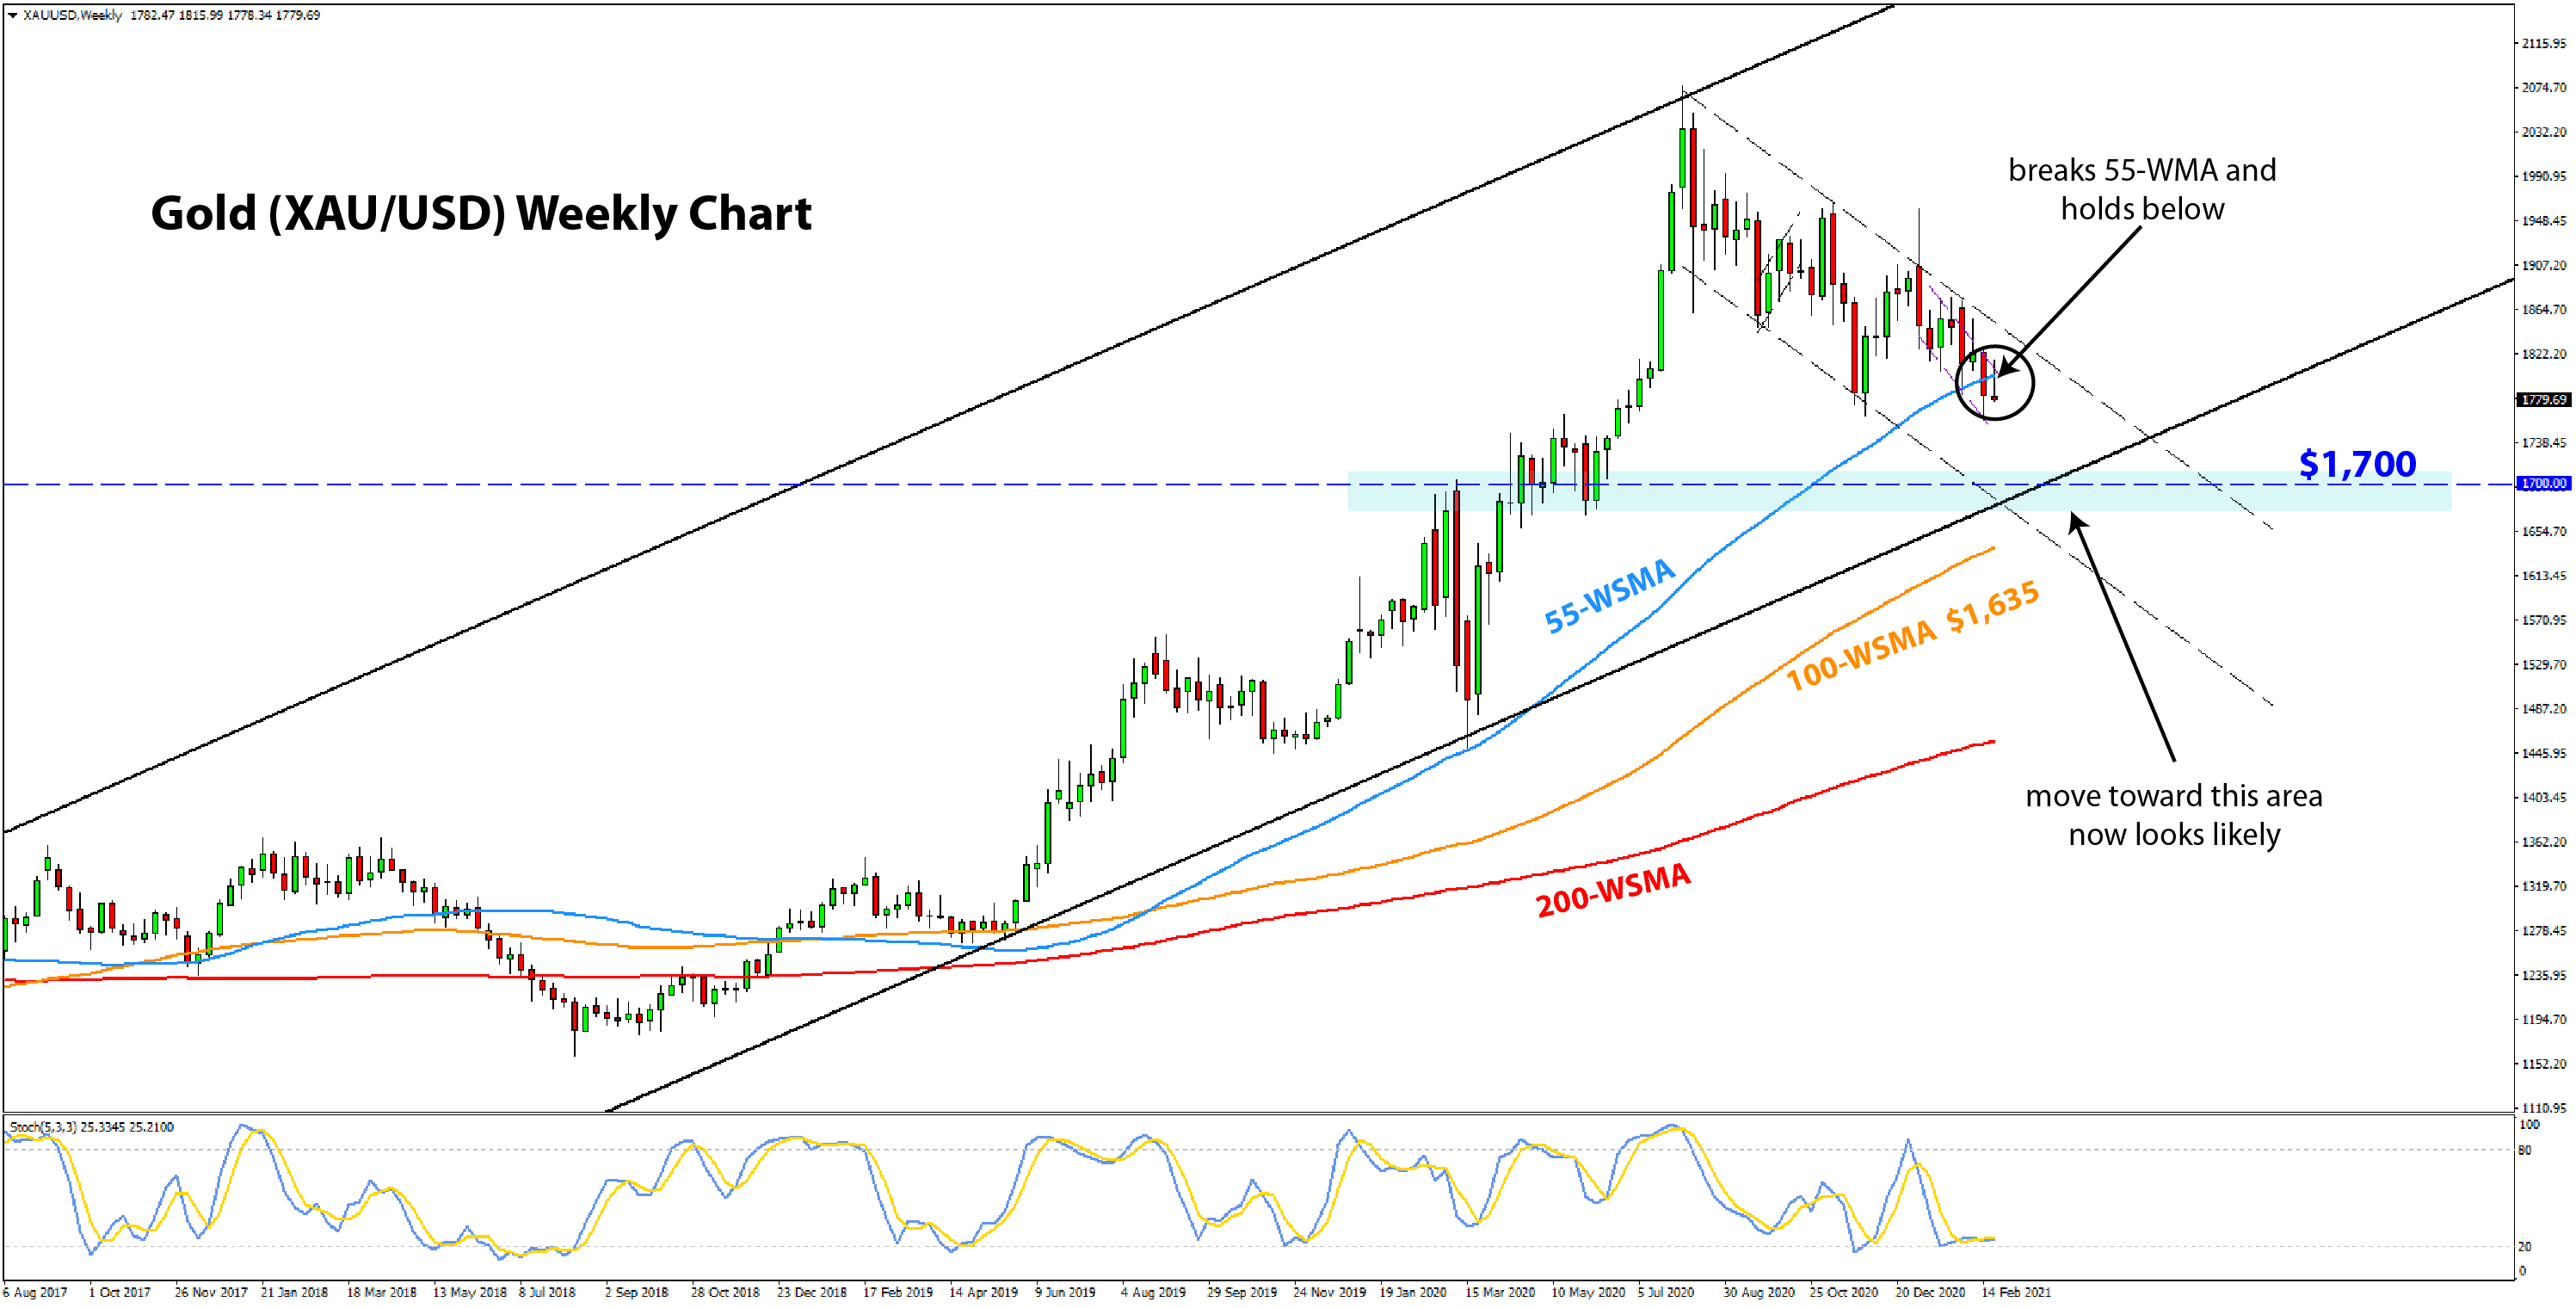
Looking at the same gold chart that we showed three months ago, we can see that some important developments have occurred in recent weeks. The channel so far holds nicely, but the short-term technical picture here is turning more bearish.
Most notably, after failing at the channel’s upper border, we now have a weekly close below the 55-week moving average (blue), just as the bears are making another attack on the $1,800 low from November. Moreover, the daily chart shows that the gold price is now trading below all three key moving averages, the 55-day, 100-day, and 200-day MAs. Overall, these signs set the
stage for an extension of the bearish move lower, most probably toward the $1,650 - $1,700 area, as we described back in November. There, however, at $1,650 - $1,700, gold is likely to encounter strong buying pressures. So, watch out for that.
They've been called the "most boring stocks on earth." But I wouldn't trade them for the world. These stocks payout whether the market moves up, down, or sideways (they are mandated by law to make a profit). Today's market roller coaster ride is proof that these "boring" stocks are (or should be) a critical part of your investment strategy.
In the meantime, how can you trade the downside potential if it comes to fruition?
The places to look for tactical opportunities to go short are at the lower timeframes, such as the daily and intraday charts (4h and 1h). Look for bearish setups on the smaller timeframes and aim to converge that with the key S/R zones and developments on the weekly chart. For example, a bearish pattern on the daily or 4h chart that occurs at a weekly resistance area has a much higher
chance of success than if the weekly resistance isn’t there.
We might get another rally in gold toward the $1,830 - $1,870 area, which is the channel’s resistance. But there is always the possibility that the price continues straight lower from here.
And finally, remember that the long-term trend in gold remains up, as we said in our analysis in November. While it is likely gold will extend to the downside in the near-term, the bullish factors remain very much in place on a long-term horizon. Low and negative interest rates with massive amounts of debt and money printing should continue to support gold in the following
months. So, from this perspective, we should be careful when taking any short trades here because any bearish move can quickly reverse when the uptrend resumes.
Trade signals from the past week
- February 12 - Long USDCHF from 0.8935, 1st target reached at 0.9050 = +115 pips profit
- February 19 - Long NZDUSD from 0.7290, target reached at 0.7450 area = +160 pips profit
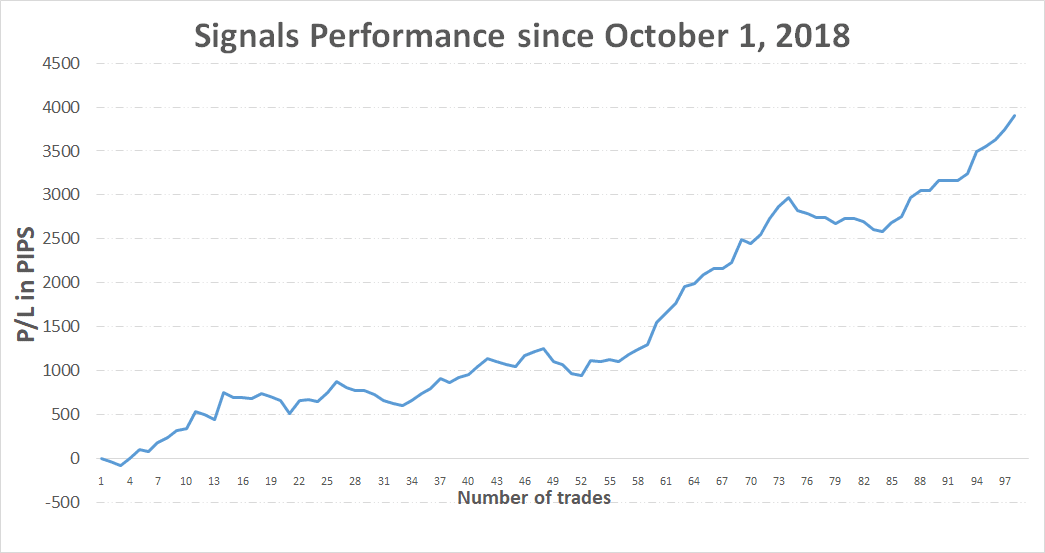
TOTAL: +275 pips profit in the past week
TOTAL: +3900 pips profit since October 1, 2018
If you have any questions or feedback, don't hesitate to reply to this email.
Thank you!
High Risk Warning: Please note that foreign exchange and other leveraged trading involves significant risk of loss. It is not suitable for all investors and you should make sure you understand the risks involved, seeking independent advice if necessary.
Any opinions, news, research, predictions, analyses, prices or other information contained in this newsletter is provided as general market commentary and does not constitute investment advice. FX Trading Revolution will not accept liability for any loss or damage including, without limitation, to any loss of profit which may arise directly or indirectly from use of or reliance on such information.
|
|
|
|