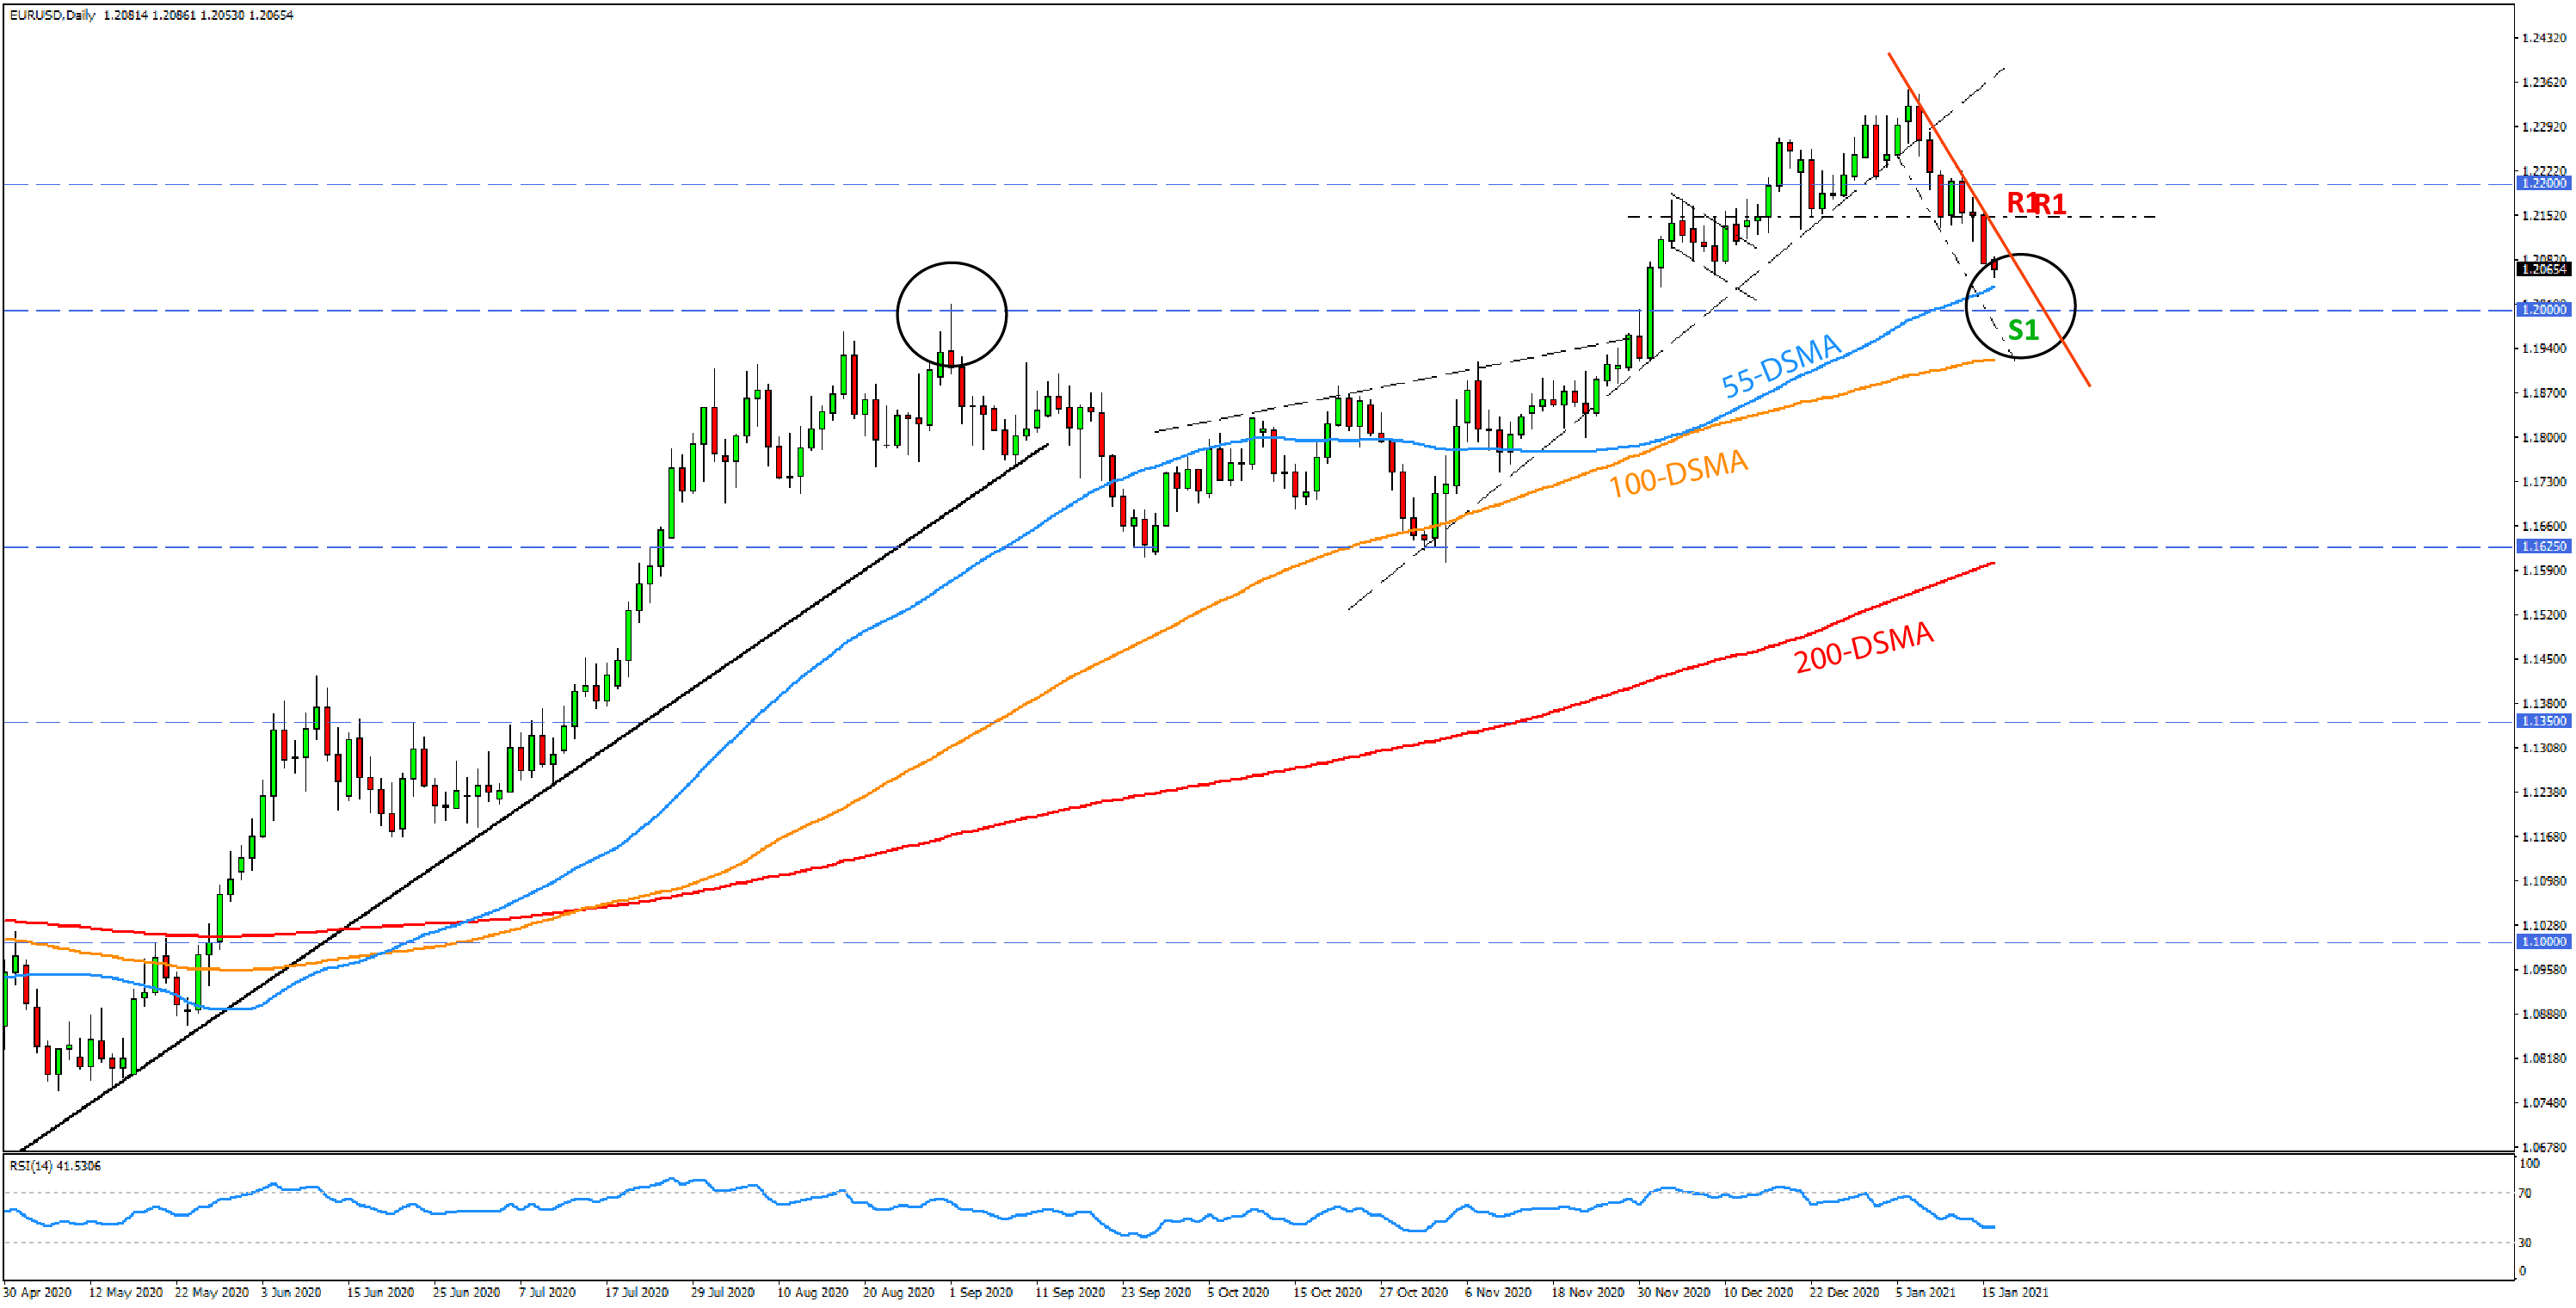
The daily chart gives a more detailed view into the recent EURUSD correction lower. We can see how the price broke some technical levels and trendline support and has now started a downside move from the highs.
The price is now nearing the 1.20 support zone, where also the 55-day moving average currently sits. Some reaction or bounce is likely at this stage, though the pace of the decline suggests the correction can go deeper than 1.20. The 100-day moving average
(orange) and technicals on the weekly chart suggest 1.19 could be the area that EURUSD will soon reach before this correction stops.
To the upside, there is no clear, strong resistance nearby, but the 1.22 zone needs to hold to keep the corrective move intact. Moderate resistance exists at 1.21 and a stronger zone at 1.2150.