EUR/USD, GBP/USD, USD/JPY
Weekly Forex Analysis
(March 22 - March 26, 2021)
Hey! This is Philip with our new weekly outlook for EUR/USD, GBP/USD, and USD/JPY.
USDJPY Technical Analysis
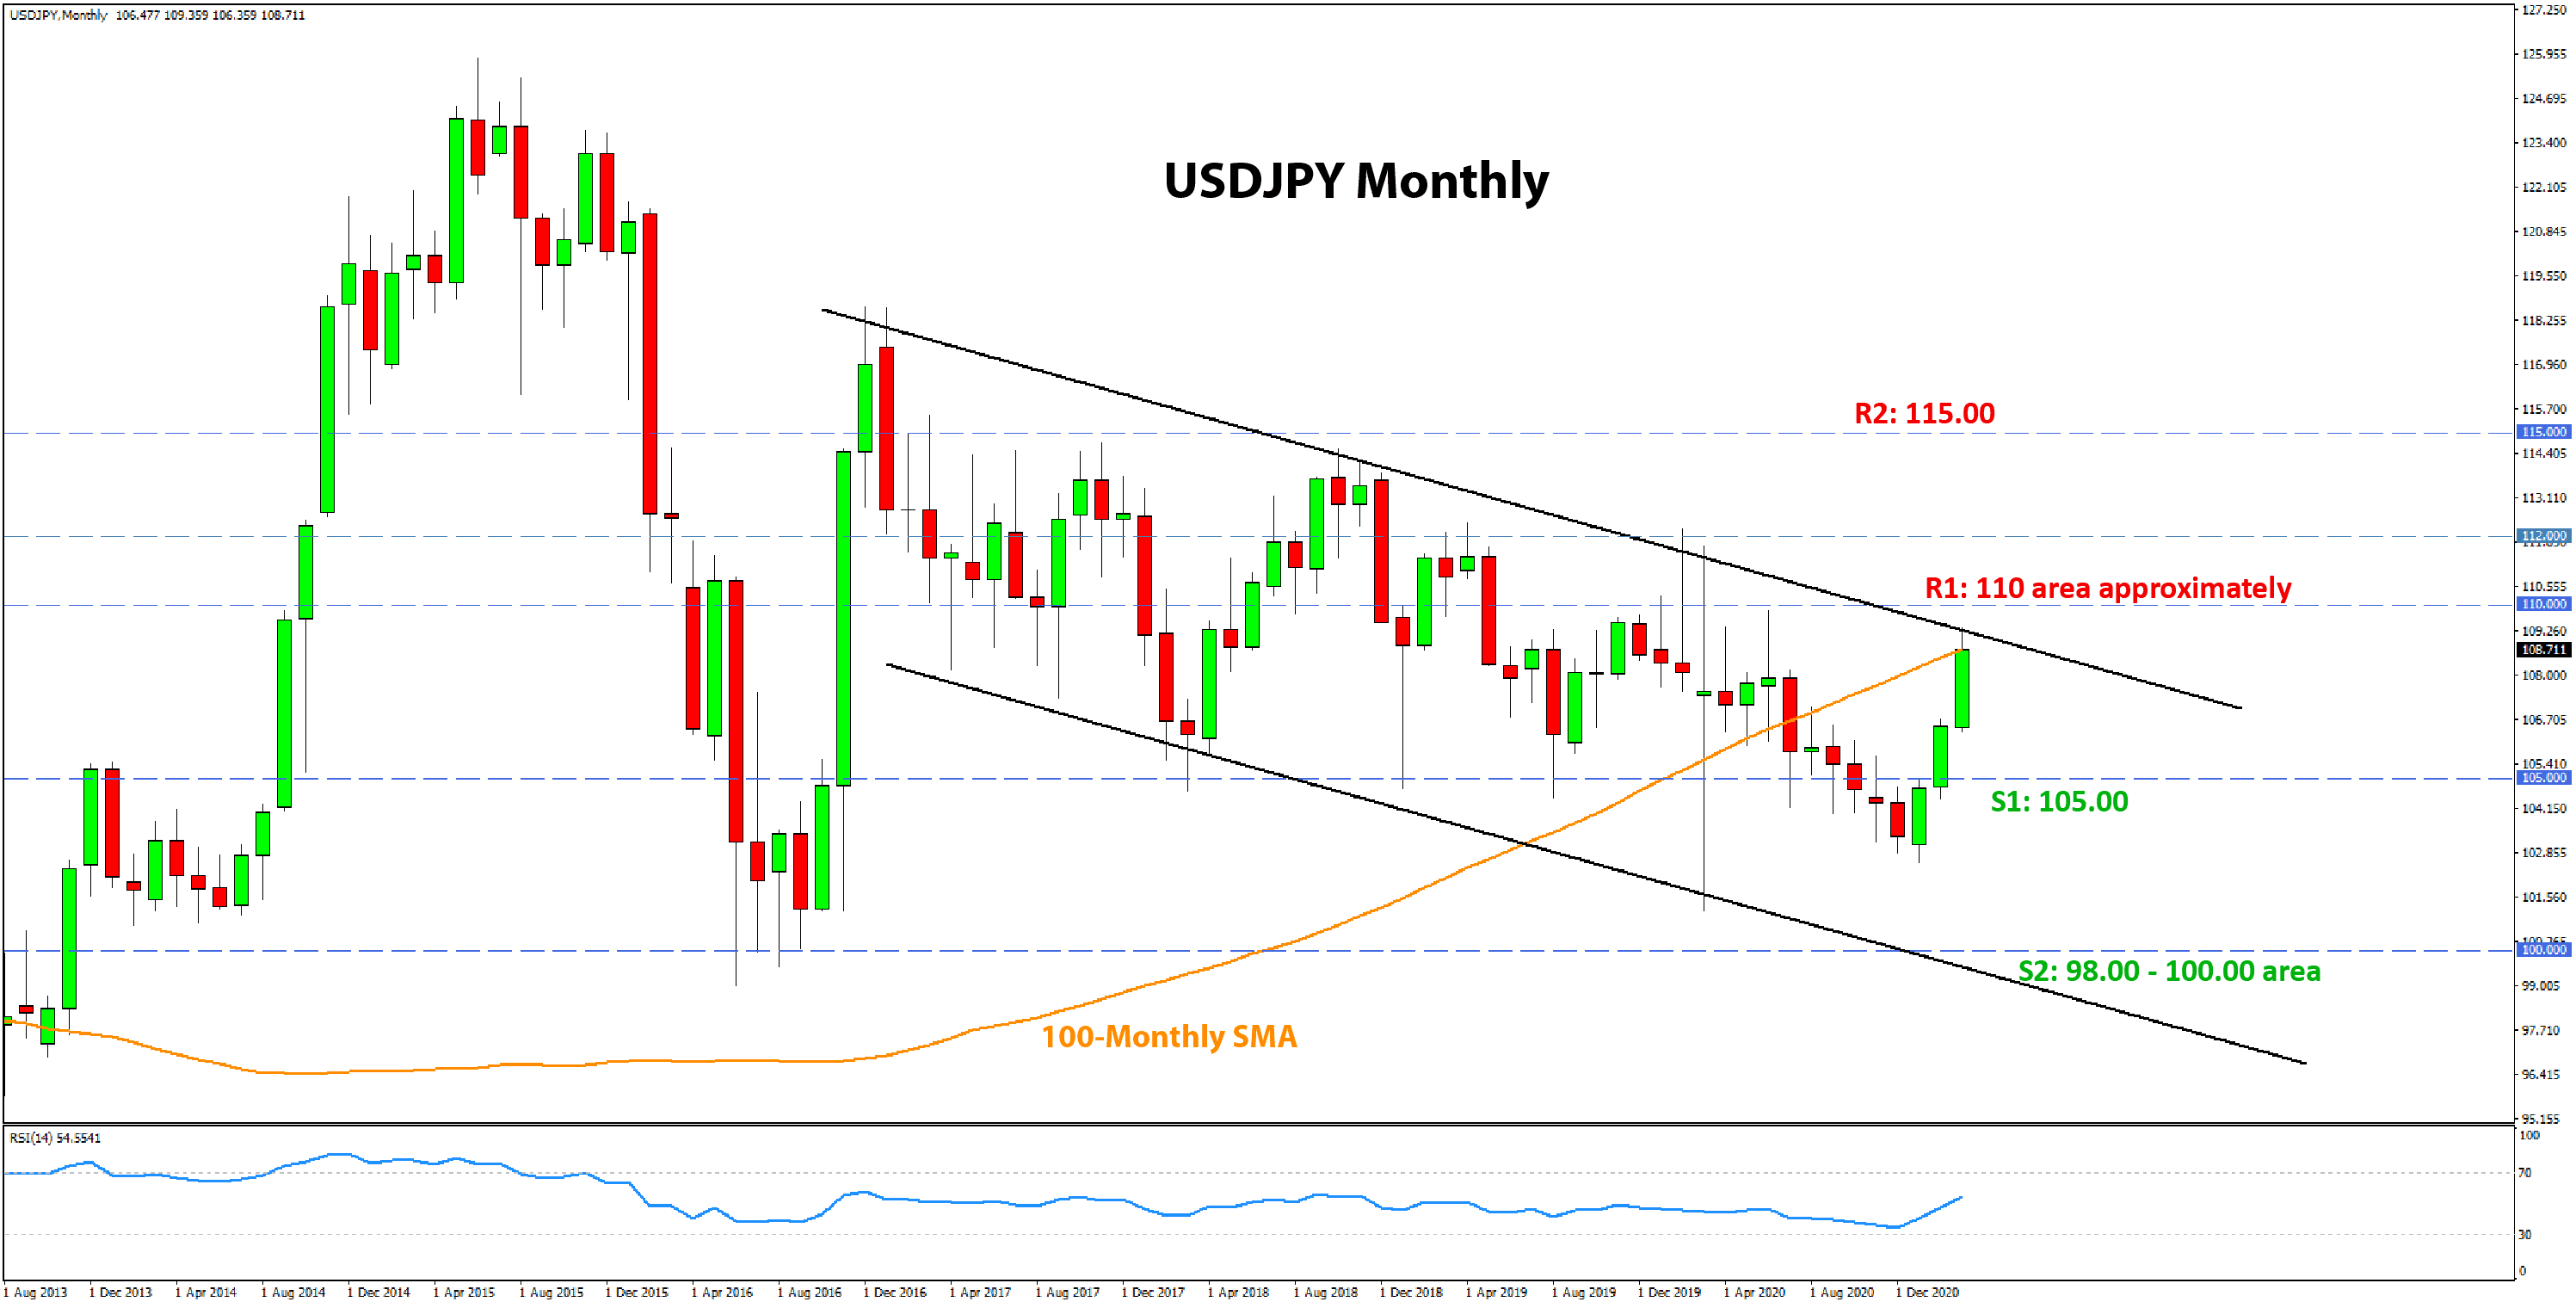
This week we decided to show the monthly USDJPY chart as it appears something of great importance is happening there. Namely, the pair has reached a significant monthly resistance zone at the 110.00 area, which may stretch as high as 112.00 before being considered fully broken.
Essentially, this chart shows the protracted USDJPY consolidation with a downward tendency since December 2016. It appears clearer now that the consolidation has shaped up into a channel formation, which presently puts its resistance trendline around 110.00. Notably, March 2020 saw both the resistance and support lines of this channel
tested.
What happens here now is hard to tell. Although lower timeframes show momentum is strong and USDJPY can go to 110.00 and above, the monthly resistance here is significant. Remember, only with a strong momentum close above 112.00 will this consolidative channel formation be deemed
broken. Subsequently, such a scenario – if it transpires – would have massive bullish implications for the USDJPY pair.
America's #1 trading champion, Chuck Hughes, wants to share his tips and tricks with you, but hurry! Time is running out. Get a free copy of "Options Trading Made Easy" when you register for the Trade of the Day eletter. Full of advice, tips, and tricks!
If you have any questions or feedback, don't hesitate to reply to this email.
High Risk Warning: Please note that foreign exchange and other leveraged trading involves significant risk of loss. It is not suitable for all investors and you should make sure you understand the risks involved, seeking independent advice if necessary.
Any opinions, news, research, predictions, analyses, prices or other information contained in this newsletter is provided as general market commentary and does not constitute investment advice. FX Trading Revolution will not accept liability for any loss or damage including, without limitation, to any loss of profit which may arise directly or indirectly from use of or reliance on such information.
|
|
|
|