Free Profitable Forex Newsletter
Hey! This is Philip with this week's trade idea of the Free Profitable Forex Newsletter!
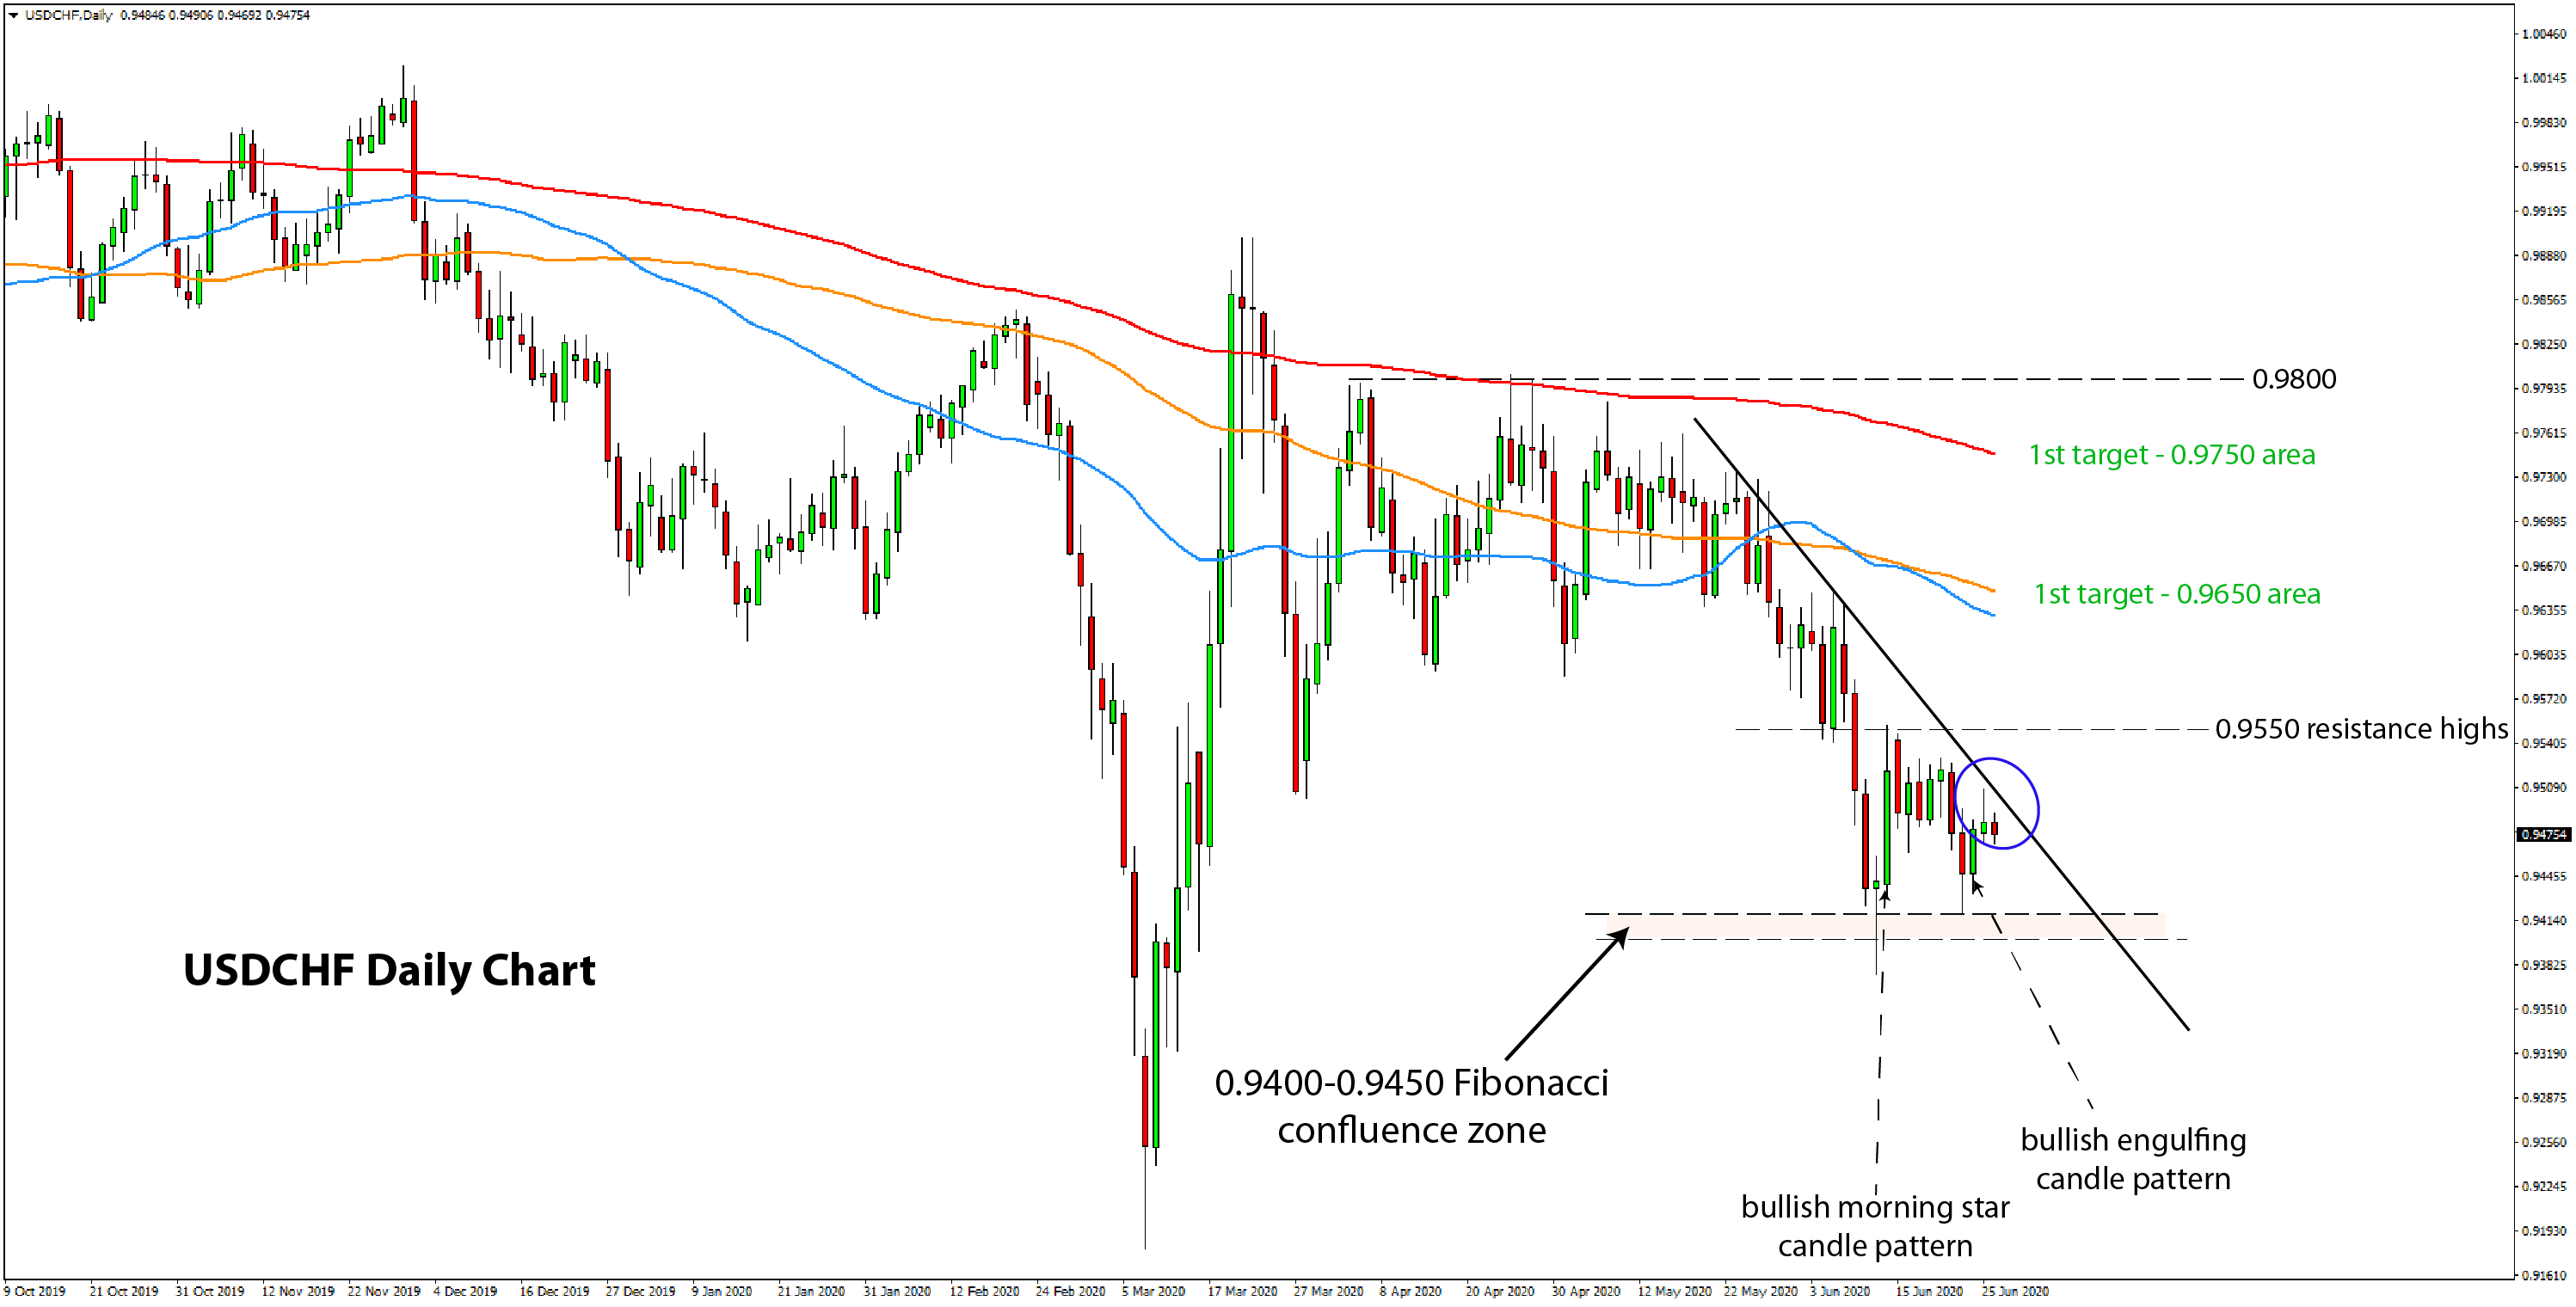
The price action on USDCHF suggests that the pair has found solid support in the 0.9400-0.9450 area. The foundations for a double bottom are laid out, but the pattern won’t be confirmed until USDCHF breaks above the 0.9550 highs.
A resistance trendline can also be drawn down from the late May highs, and the price is currently testing it. A bullish breakout here will be the first sign that the bulls are starting to take control on USDCHF.
The 0.9400-0.9450 area is also a Fibonacci confluence zone from the 100% expansion of the late March bearish leg and the 127.2% extension of the April retracement leg. So, the support in this area is solid and has been confirmed on two occasions, with a bullish morning star and a bullish engulfing pattern.
The technical picture of the daily USDCHF chart is shown below:
USDCHF may be able to extend the rebound higher in what could be a broader USD rebound also. For example, EURUSD is getting rejected at the 1.1350 resistance for 3 weeks in a row now. At the same time, the DXY Dollar Index is also showing signs of a base.
Thus, USDCHF is an interesting pair to play a general USD rebound. Keep in mind, however, that risk sentiment remains fragile, especially now that COVID-19 cases are again on the rise everywhere. If this second wave of infections turns ugly like the first one, it would surely spur risk aversion further. In such a case, CHF may benefit, and this setup may not work out as planned. Nonetheless, the safe-haven status
of the USD should at least keep USDCHF less volatile in such a scenario, or even pull it higher (such as we saw in March).
Note that this USDCHF setup is mainly based on technicals as most Fx pairs are stuck in ranges at the moment. We aren’t discussing the fundamentals much this time because they have taken a back seat for the past 3 months as central banks continue to do their magic in the currency market.
- Wait for a breakout above the resistance trendline;
- Currently, it stands around the 0.9500 round number;
- A clear breakout above 0.9500 should provide more confirmation for further upside
Stop loss:
- Below the 0.9400-0.9450 support zone;
- Note that the price may test even lower levels such as the June;
- The stop can be trailed higher and moved to breakeven as the position moves into profit
Targets:
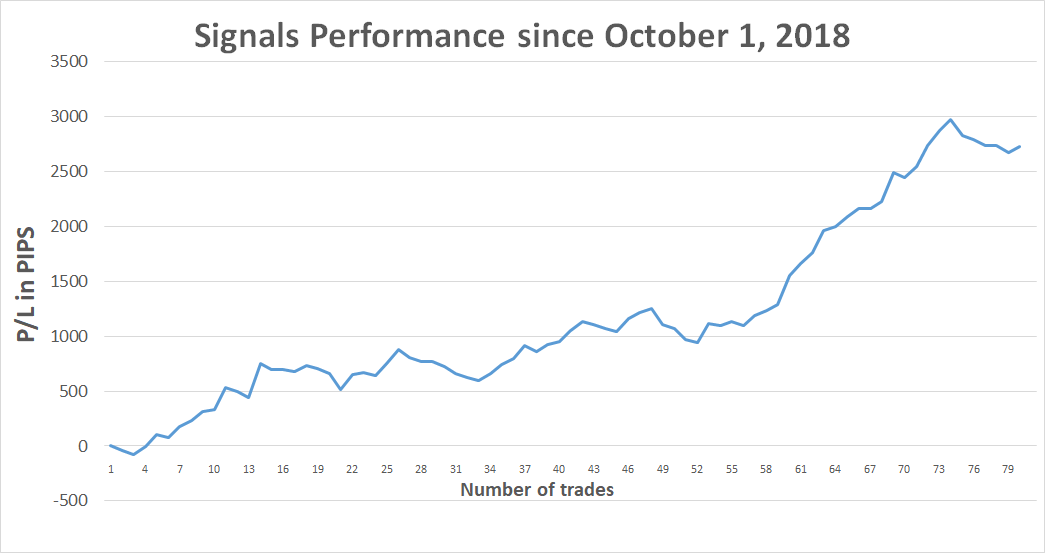
Trade signals from the past week
TOTAL: 0 pips in the past week
TOTAL: +2725 pips profit since October 1, 2018
If you have any questions or feedback, don't hesitate to reply to this email.
Thank you!
High Risk Warning: Please note that foreign exchange and other leveraged trading involves significant risk of loss. It is not suitable for all investors and you should make sure you understand the risks involved, seeking independent advice if necessary.
Any opinions, news, research, predictions, analyses, prices or other information contained in this newsletter is provided as general market commentary and does not constitute investment advice. FX Trading Revolution will not accept liability for any loss or damage including, without limitation, to any loss of profit which may arise directly or indirectly from use of or reliance on such information.
|
|
|
|