Free Profitable Forex Newsletter
Hey! This is Philip with another market update of the Free Profitable Forex Newsletter!
Thin Trading In Fx As Holidays Mood Kicks In
It seems that the Christmas mood is already kicking in, and movements in the Forex market are small and confined to ranges on most pairs this week (ok except for GBP, but that’s another story). Not that we are not used to such low volatility this whole year, but opportunities can be scarce in such an environment, and technical patterns/levels may not work as expected.
Although several currency pairs have reached interesting technical levels and would be potential trading opportunities in normal conditions, it’s fairly possible that these patterns/levels won’t work as usual over the next few weeks around the Christmas and New Year’s holidays.
Long-Term Technical Analysis Of AUDUSD & NZDUSD; Pairs At Key Technical Levels
Therefore, again we are not recommending any specific trade idea, and we’ll stay away from trading over the next few weeks.
In the meantime, I decided to share this long-term technical analysis of the AUDUSD and NZDUSD currency pairs below, since we don’t analyze those pairs in our weekly analysis articles on a regular basis. Both have reached key resistance areas and are shaping important patterns.
Also, stay tuned for our yearly 2020 Forex analysis, which will be published at the beginning of the new year.
So, let’s now get into AUDUSD and NZDUSD long-term technicals.
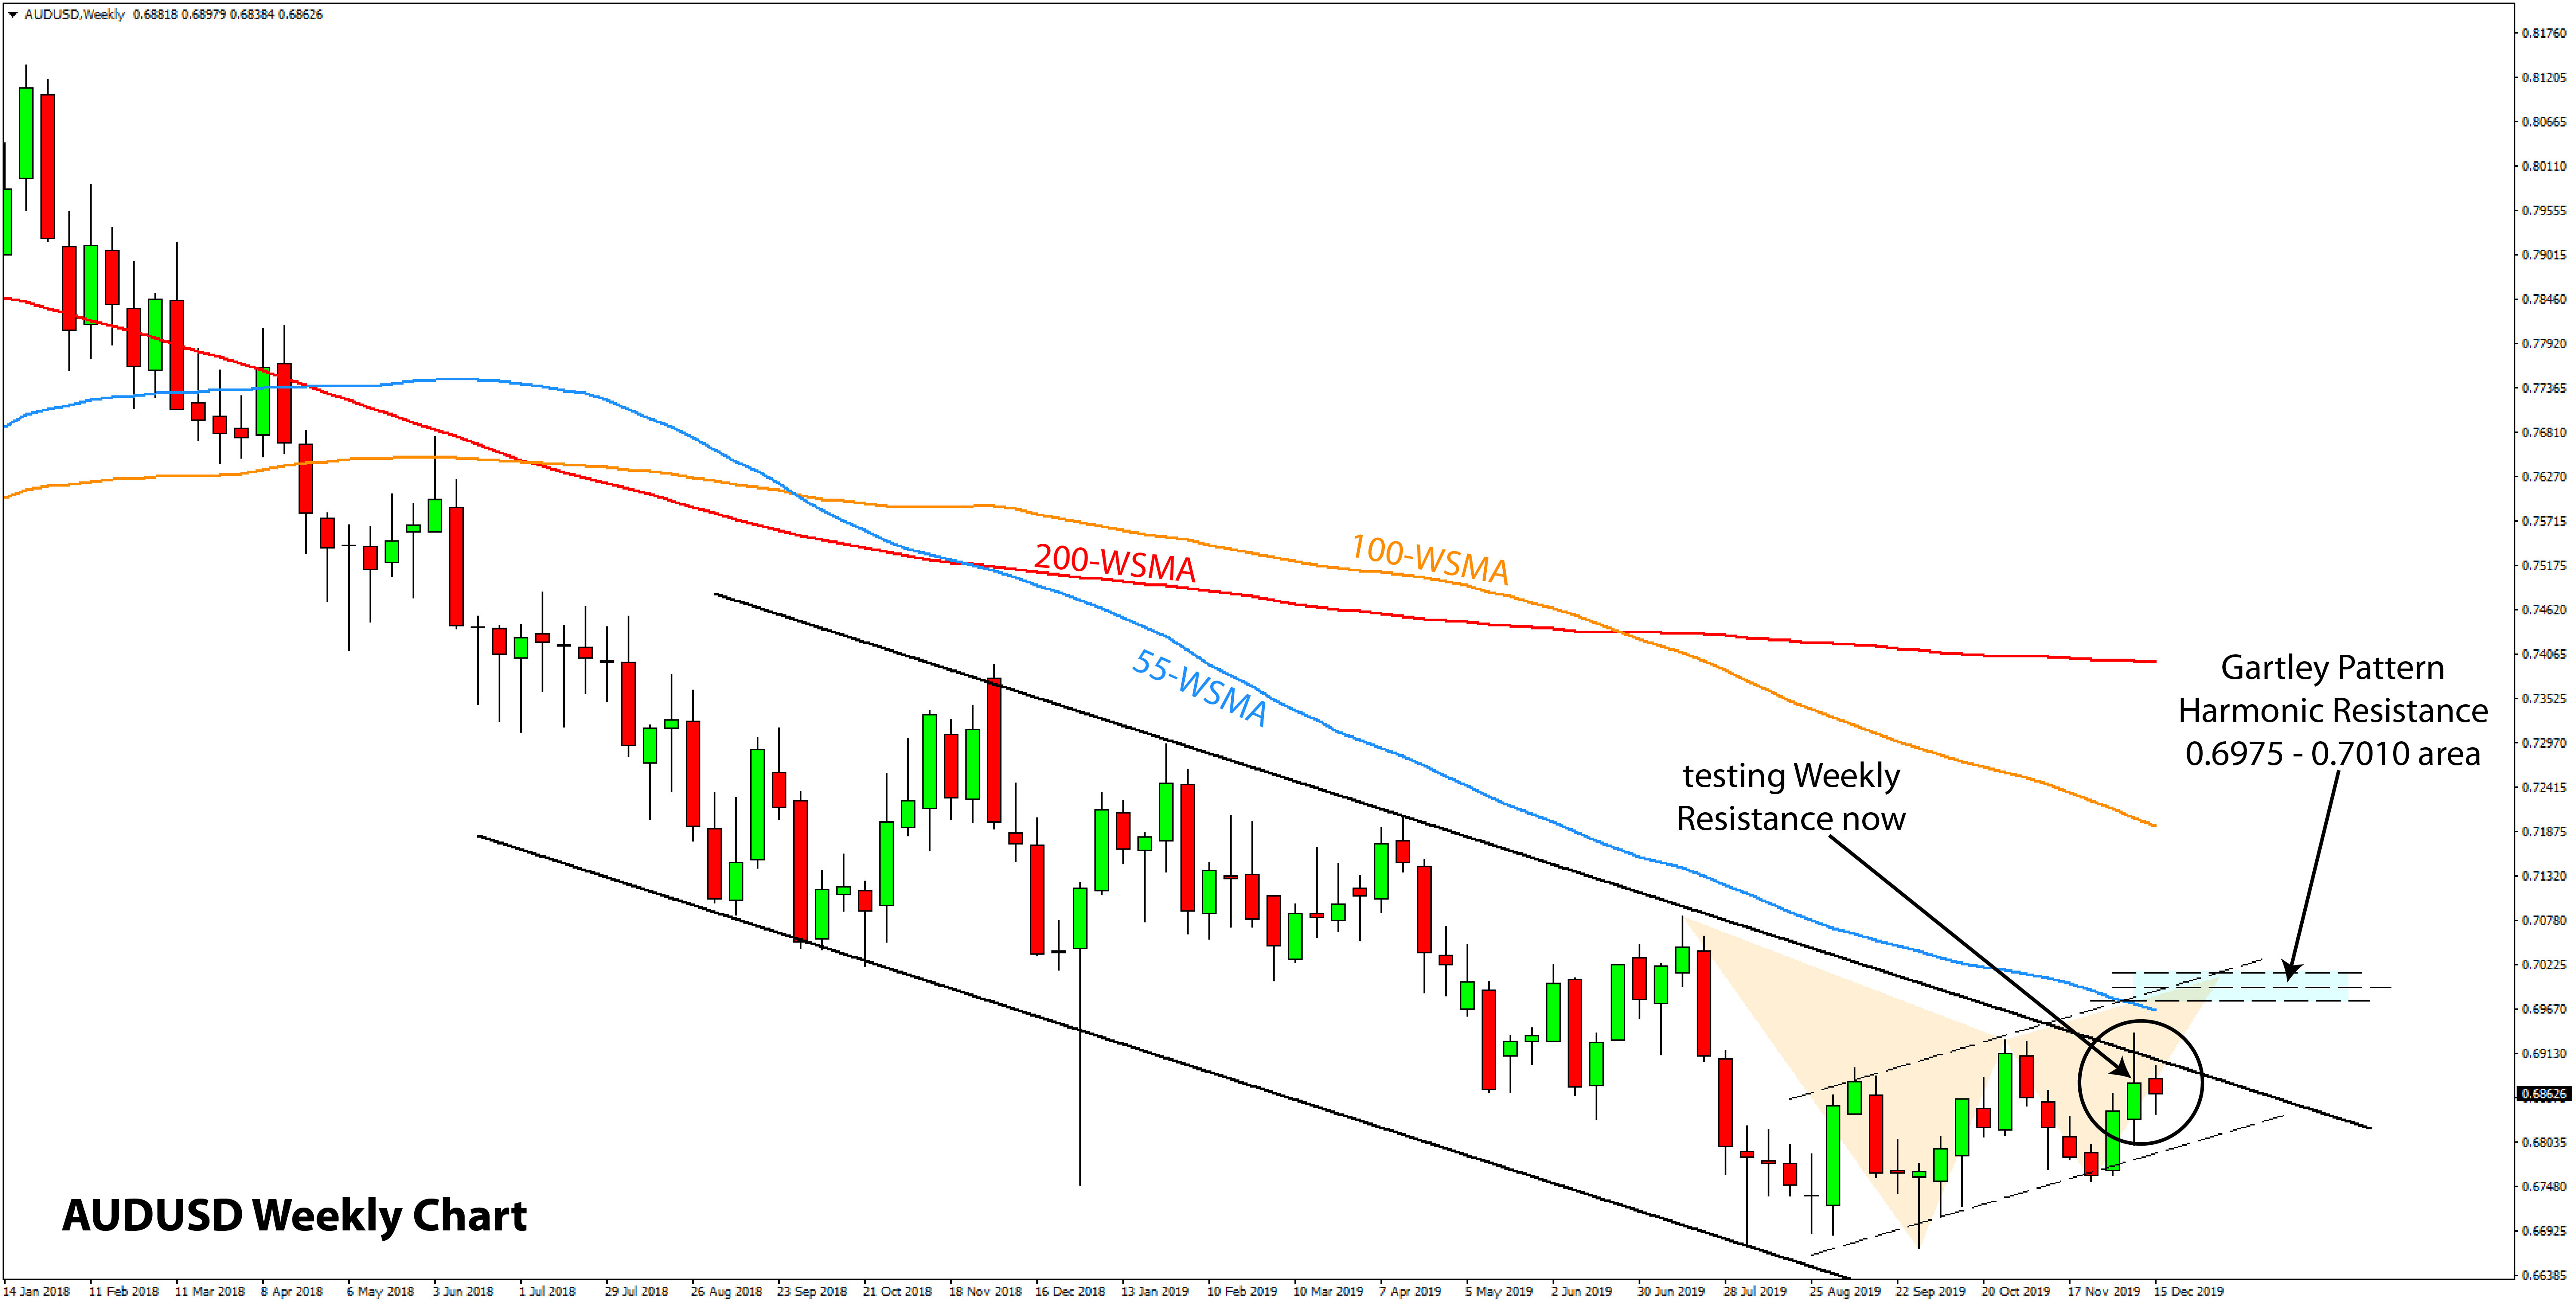
The AUDUSD pair is in a downtrend for almost 2 straight years.
What started as a steep decline in January 2018 continued as a more gradual downtrend over the course of 2019. We can see this clearly on the weekly chart where AUDUSD is trading in a well-defined bearish channel for the past 12 - 13 months.
- The pair made a bullish attempt on the resistance trendline of this +1-year old bearish channel last week. But, the attempt was rejected, and no bearish signal is formed here yet.
- AUDUSD is also forming interesting patterns with the latest movements. For instance, a bearish Gartley pattern will be completed if AUDUSD continues higher and reaches the 0.70 area. This is another key point to watch as a bullish breakout of the channel may not be the definite sign that a bottom has been put in place. This bearish Gartley pattern may still lead AUDUSD lower later. Particularly, harmonic patterns
on such large timeframes can be significant, and their ending point is a strong technical area (in this case, resistance).
- The 55 weekly moving average (blue line on the chart) is also adding additional resistance in this area.
Explore This Unique Offer
In addition to the strong resistance areas described above, the most recent rally looks like a consolidation/retracement technical pattern. Thus, downside continuation certainly seems possible. If that occurs, then AUDUSD can break below the 0.6600 lows next year.
However, if AUDUSD breaks the channel higher and through the Harmonic Gartley Resistance, then that would be a very bullish scenario. In such a case, AUDUSD may recover toward the 0.74 - 0.75 area.
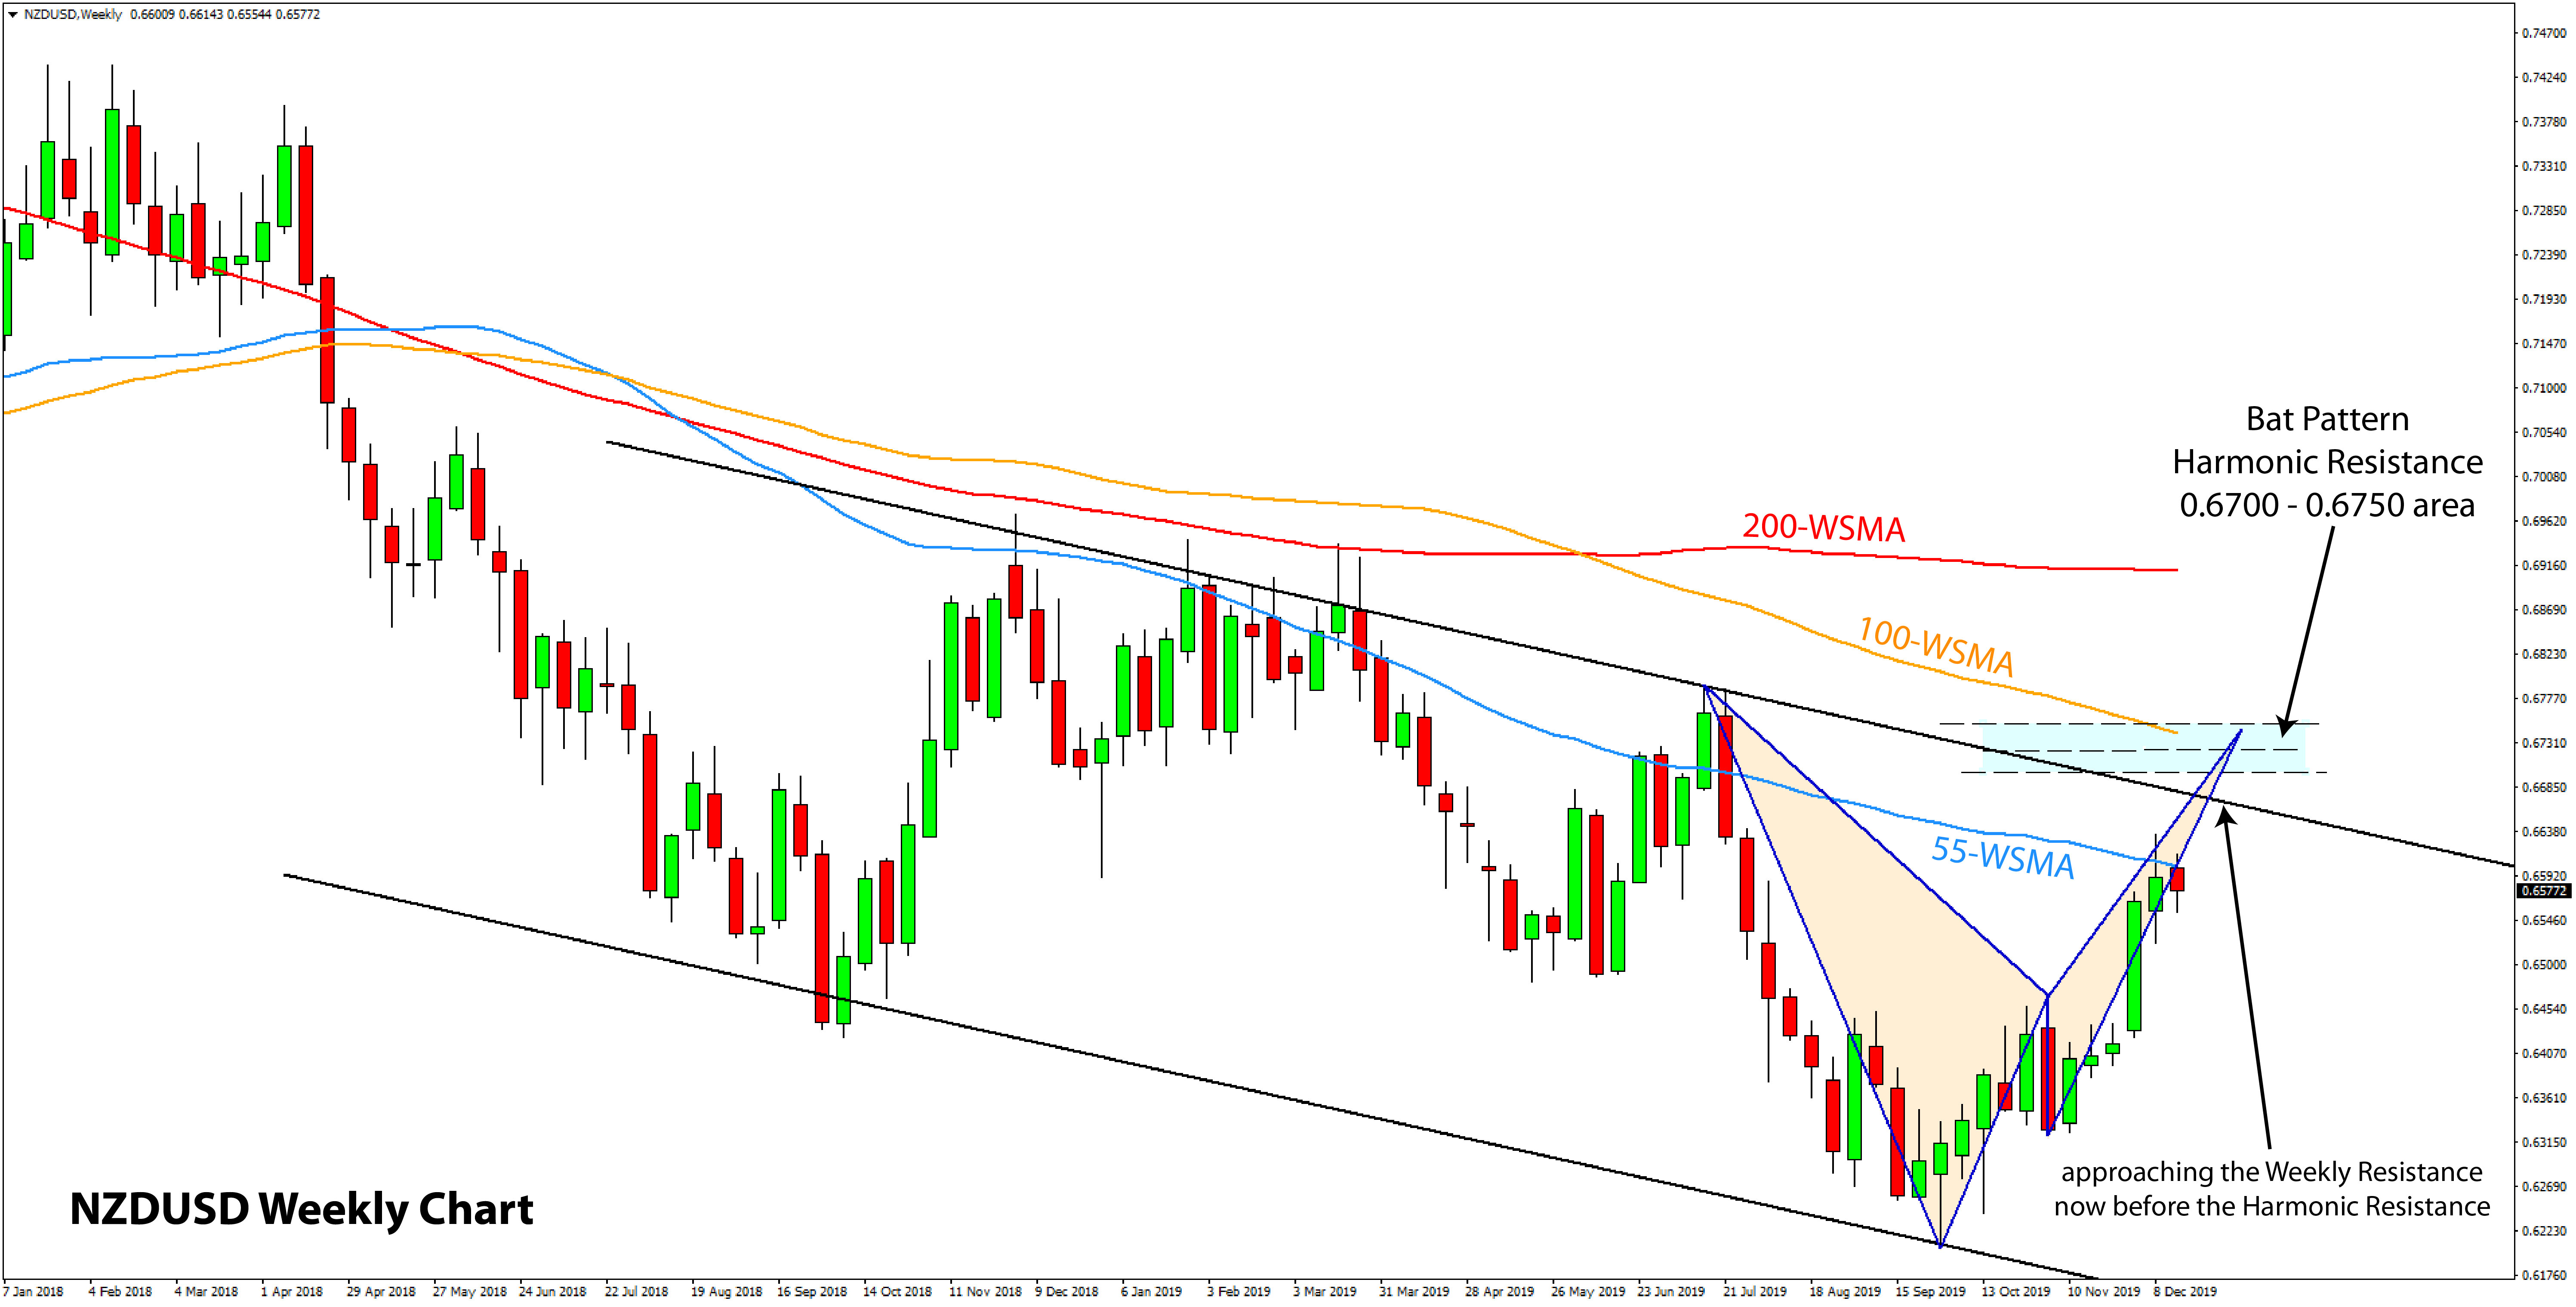
The situation on the NZDUSD pair is not much different from AUDUSD, unsurprisingly, as those two pairs move in tandem usually.
NZDUSD also peaked out in January 2018 and has been in a relatively stable decline since then, although not as steady as AUDUSD. A bearish channel is also evident here for the past 12 - 13 months.
- Also like AUDUSD, NZDUSD is forming a harmonic pattern, only it is the Bat pattern in this case (which is very similar to the Gartley pattern). The implications are the same, and this harmonic area is likely to be strong resistance here too.
- NZDUSD hasn’t reached the resistance trendline of the bearish channel yet, but it’s very close to doing that (around 50 pips away). Furthermore, the trendline resistance area here loosely overlaps with the harmonic resistance of the Bat Pattern. Thus, this is a very strong resistance area.
- NZDUSD is currently testing the 55 weekly moving average (blue line). However, even if it breaks higher, the stronger resistance area will be waiting 50 pips higher (as described in the above two points).
- The 100 weekly moving average (orange line) is inside the Bat Harmonic Resistance, strengthening this area.
Explore This Unique Offer
If the resistance here works and NZDUSD starts another bearish leg in the new year, then taking out the September 0.62 lows would be a possibility here also. In such a scenario, NZDUSD can fall toward the 0.60 area.
On the other hand, if NZDUSD breaks through both the Weekly Resistance Trendline and the Harmonic Bat Resistance, then the pair can rise toward the 0.70 area and higher.
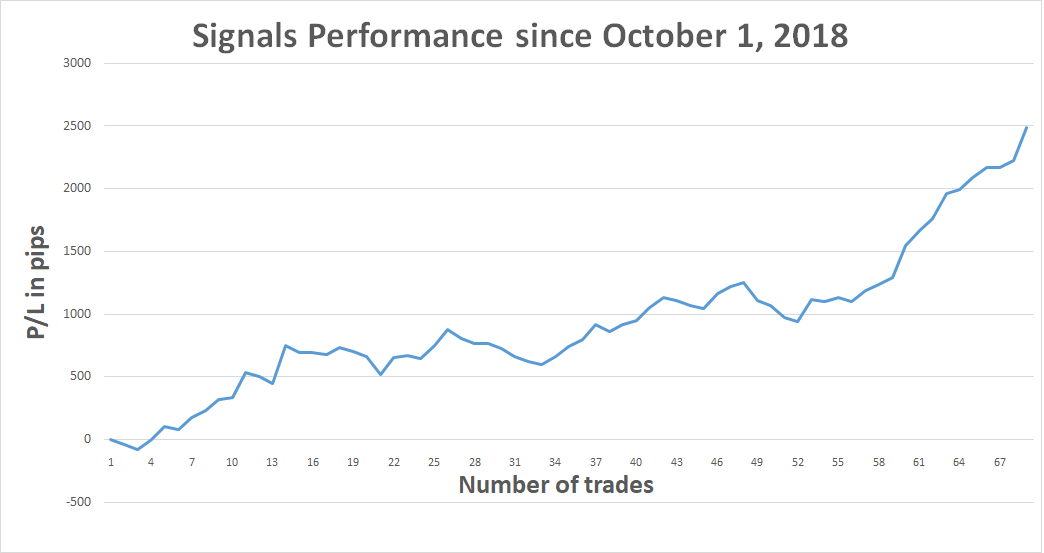
Trade signals from the past weeks
- December 05, 2019 – Short USDJPY; trade not triggered (setup canceled now)
TOTAL: +0 pips in the past week
TOTAL: +2490 pips profit since October 1, 2018
If you have any questions or feedback, don't hesitate to reply to this email.
Thank you!
High Risk Warning: Please note that foreign exchange and other leveraged trading involves significant risk of loss. It is not suitable for all investors and you should make sure you understand the risks involved, seeking independent advice if necessary.
Any opinions, news, research, predictions, analyses, prices or other information contained in this newsletter is provided as general market commentary and does not constitute investment advice. FX Trading Revolution will not accept liability for any loss or damage including, without limitation, to any loss of profit which may arise directly or indirectly from use of or reliance on such information.
|
|
|
|