Free Profitable Forex Newsletter
Hey! This is Philip with this week's trade update of the Free Profitable Forex Newsletter!
The ranges in the Fx market that were established after the Corona crisis shock continue to hold, making it difficult to find attractive trading opportunities. For these reasons, we are not looking at specific trades this week, and instead, we turn to the technical situation on the Dollar Index and Gold.
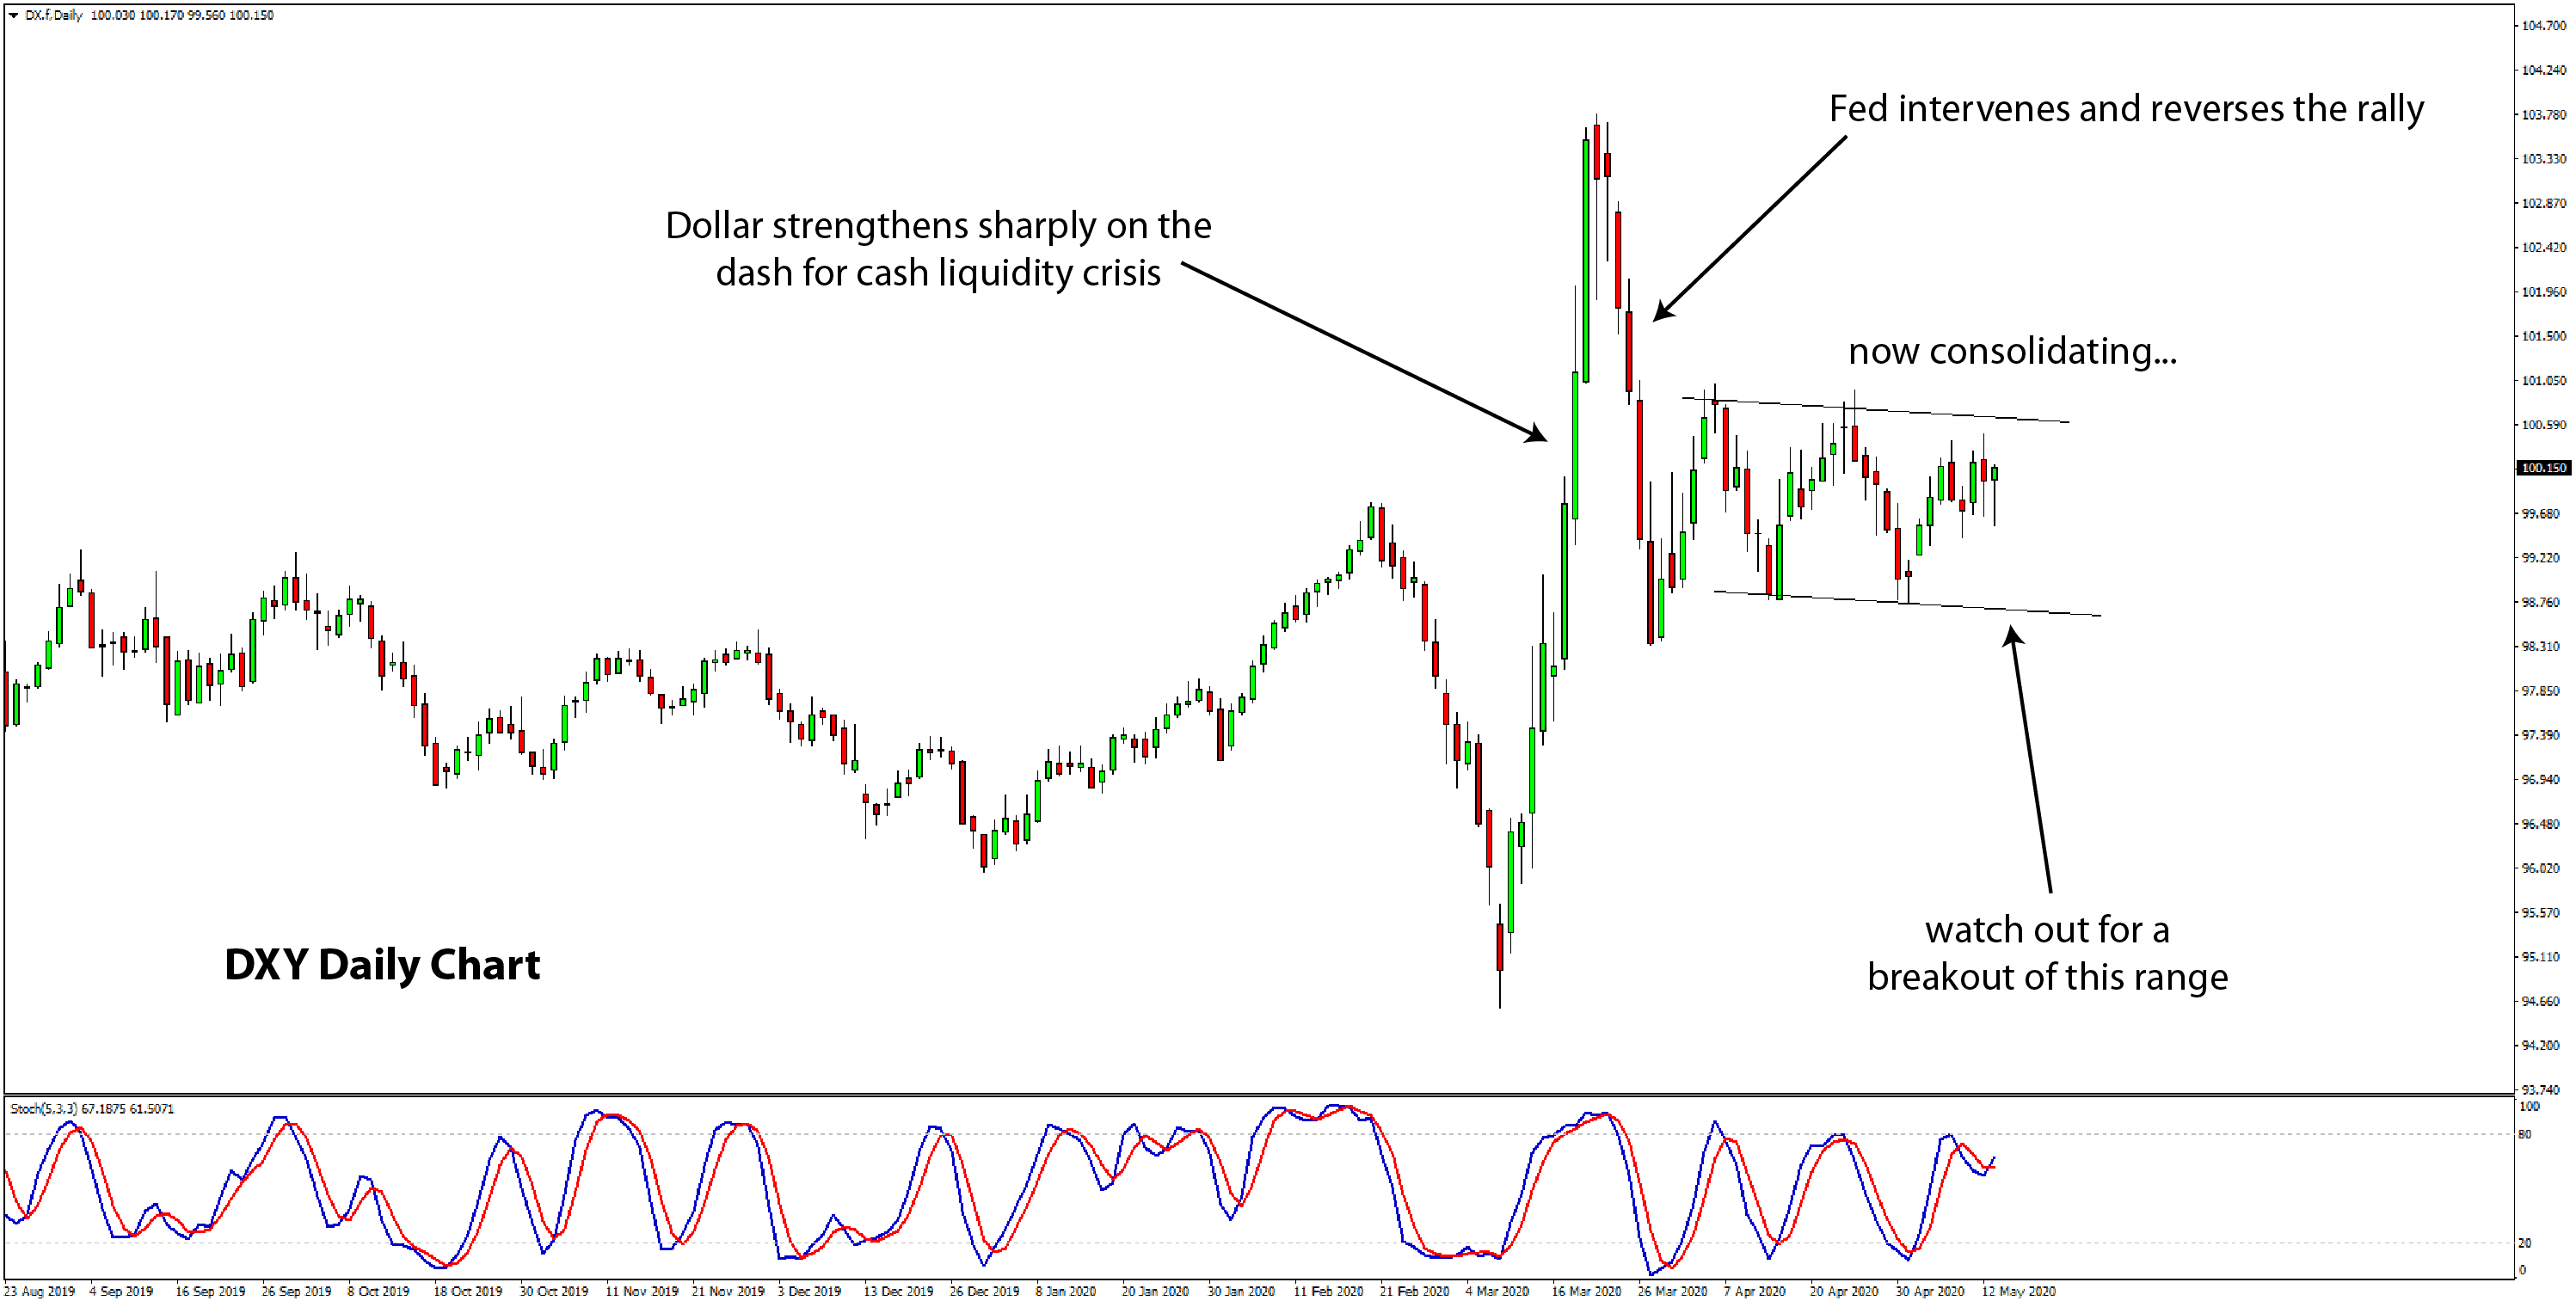
Dollar Index Consolidating In A Range Since Fed Interventions
On the daily chart of the broad Dollar index (DXY), we can see all the wild jitters caused by the Corona crisis shock, which were followed by consolidation that is now established as a range between 0.9875 and 101.00.
Also, another interesting fact is that the Dollar is at almost exactly the same levels today as in mid-February before the Corona crisis hit. The only difference is that a lot of traders lost money in the wild moves during the 1-month period between late February and late March.
For now, the name of the game is sideways ranges. The Dollar Index is currently consolidating, which is translating in sideways consolidations on many other currency pairs as well.
A breakout here on the Dollar Index chart will likely coincide with breakouts in major USD pairs such as EURUSD, GBPUSD, USDJPY, etc. This is why it’s important to keep an eye on this chart from time to time to take note if any major USD trends are developing.
Below is the Dollar Index chart with all the key levels:
Gold Consolidating In A Triangle At Crucial Weekly Resistance
The Gold technical situation is a little more interesting, and in fact, here we have the daily and the weekly charts to look at (find them below). The precious yellow metal has hit a strong resistance zone on the weekly chart and is consolidating in a small triangle on the daily chart.
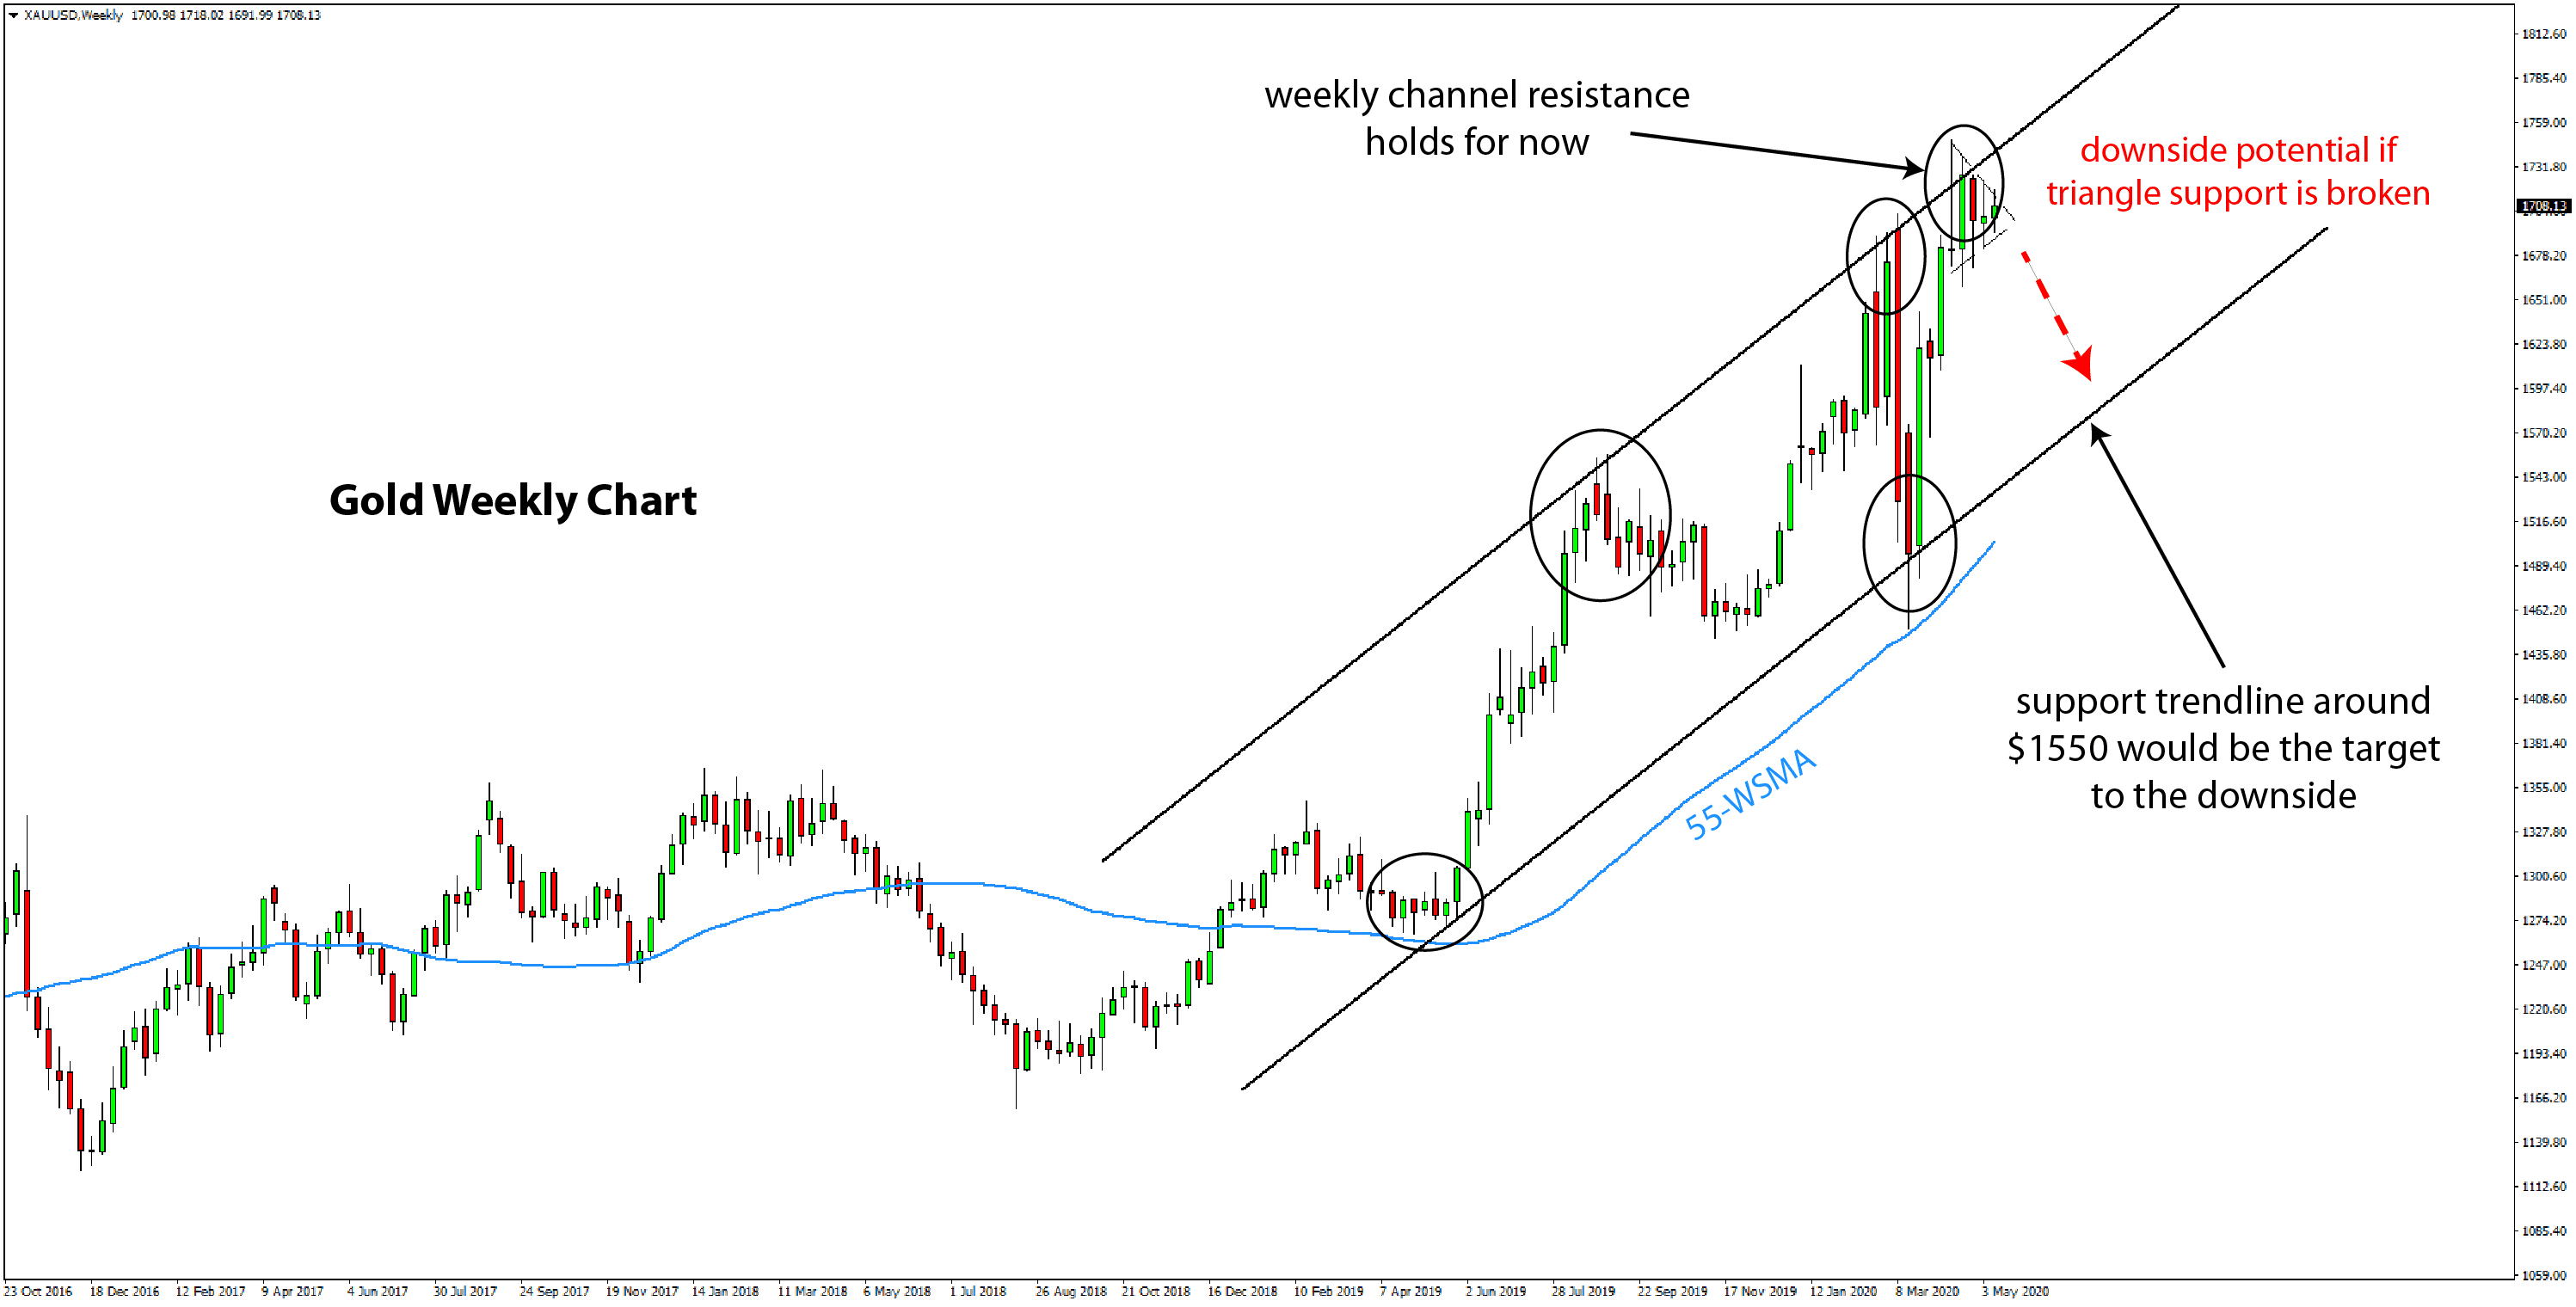
First, let’s look at the weekly chart. The resistance trendline here has held two major bullish attacks, once in August 2018, and the second time in March this year at the onset of the Corona crisis. Now could be the third time, though that remains to be seen. The $1750 area seems to be the upper range of this resistance.
We can see the triangle formation here on the weekly chart also. A bullish breakout of the triangle could mean that gold is heading further higher above the weekly resistance. Many Gold bulls will argue that gold will go much higher, especially since the current crisis environment plus massive money printing by central banks is inherently supportive for gold prices.
The weekly chart of gold with all the key levels is shown below:
Nevertheless, the support trendline of the weekly channel stands at $1550. If the daily triangle is broken to the downside, then the price may decline sharply, much like it did in March. In such a case, gold reaching the support trendline would be a fairly probable scenario. The fact that the 55-week moving average (blue line) is also nearby strengthens this area as support.
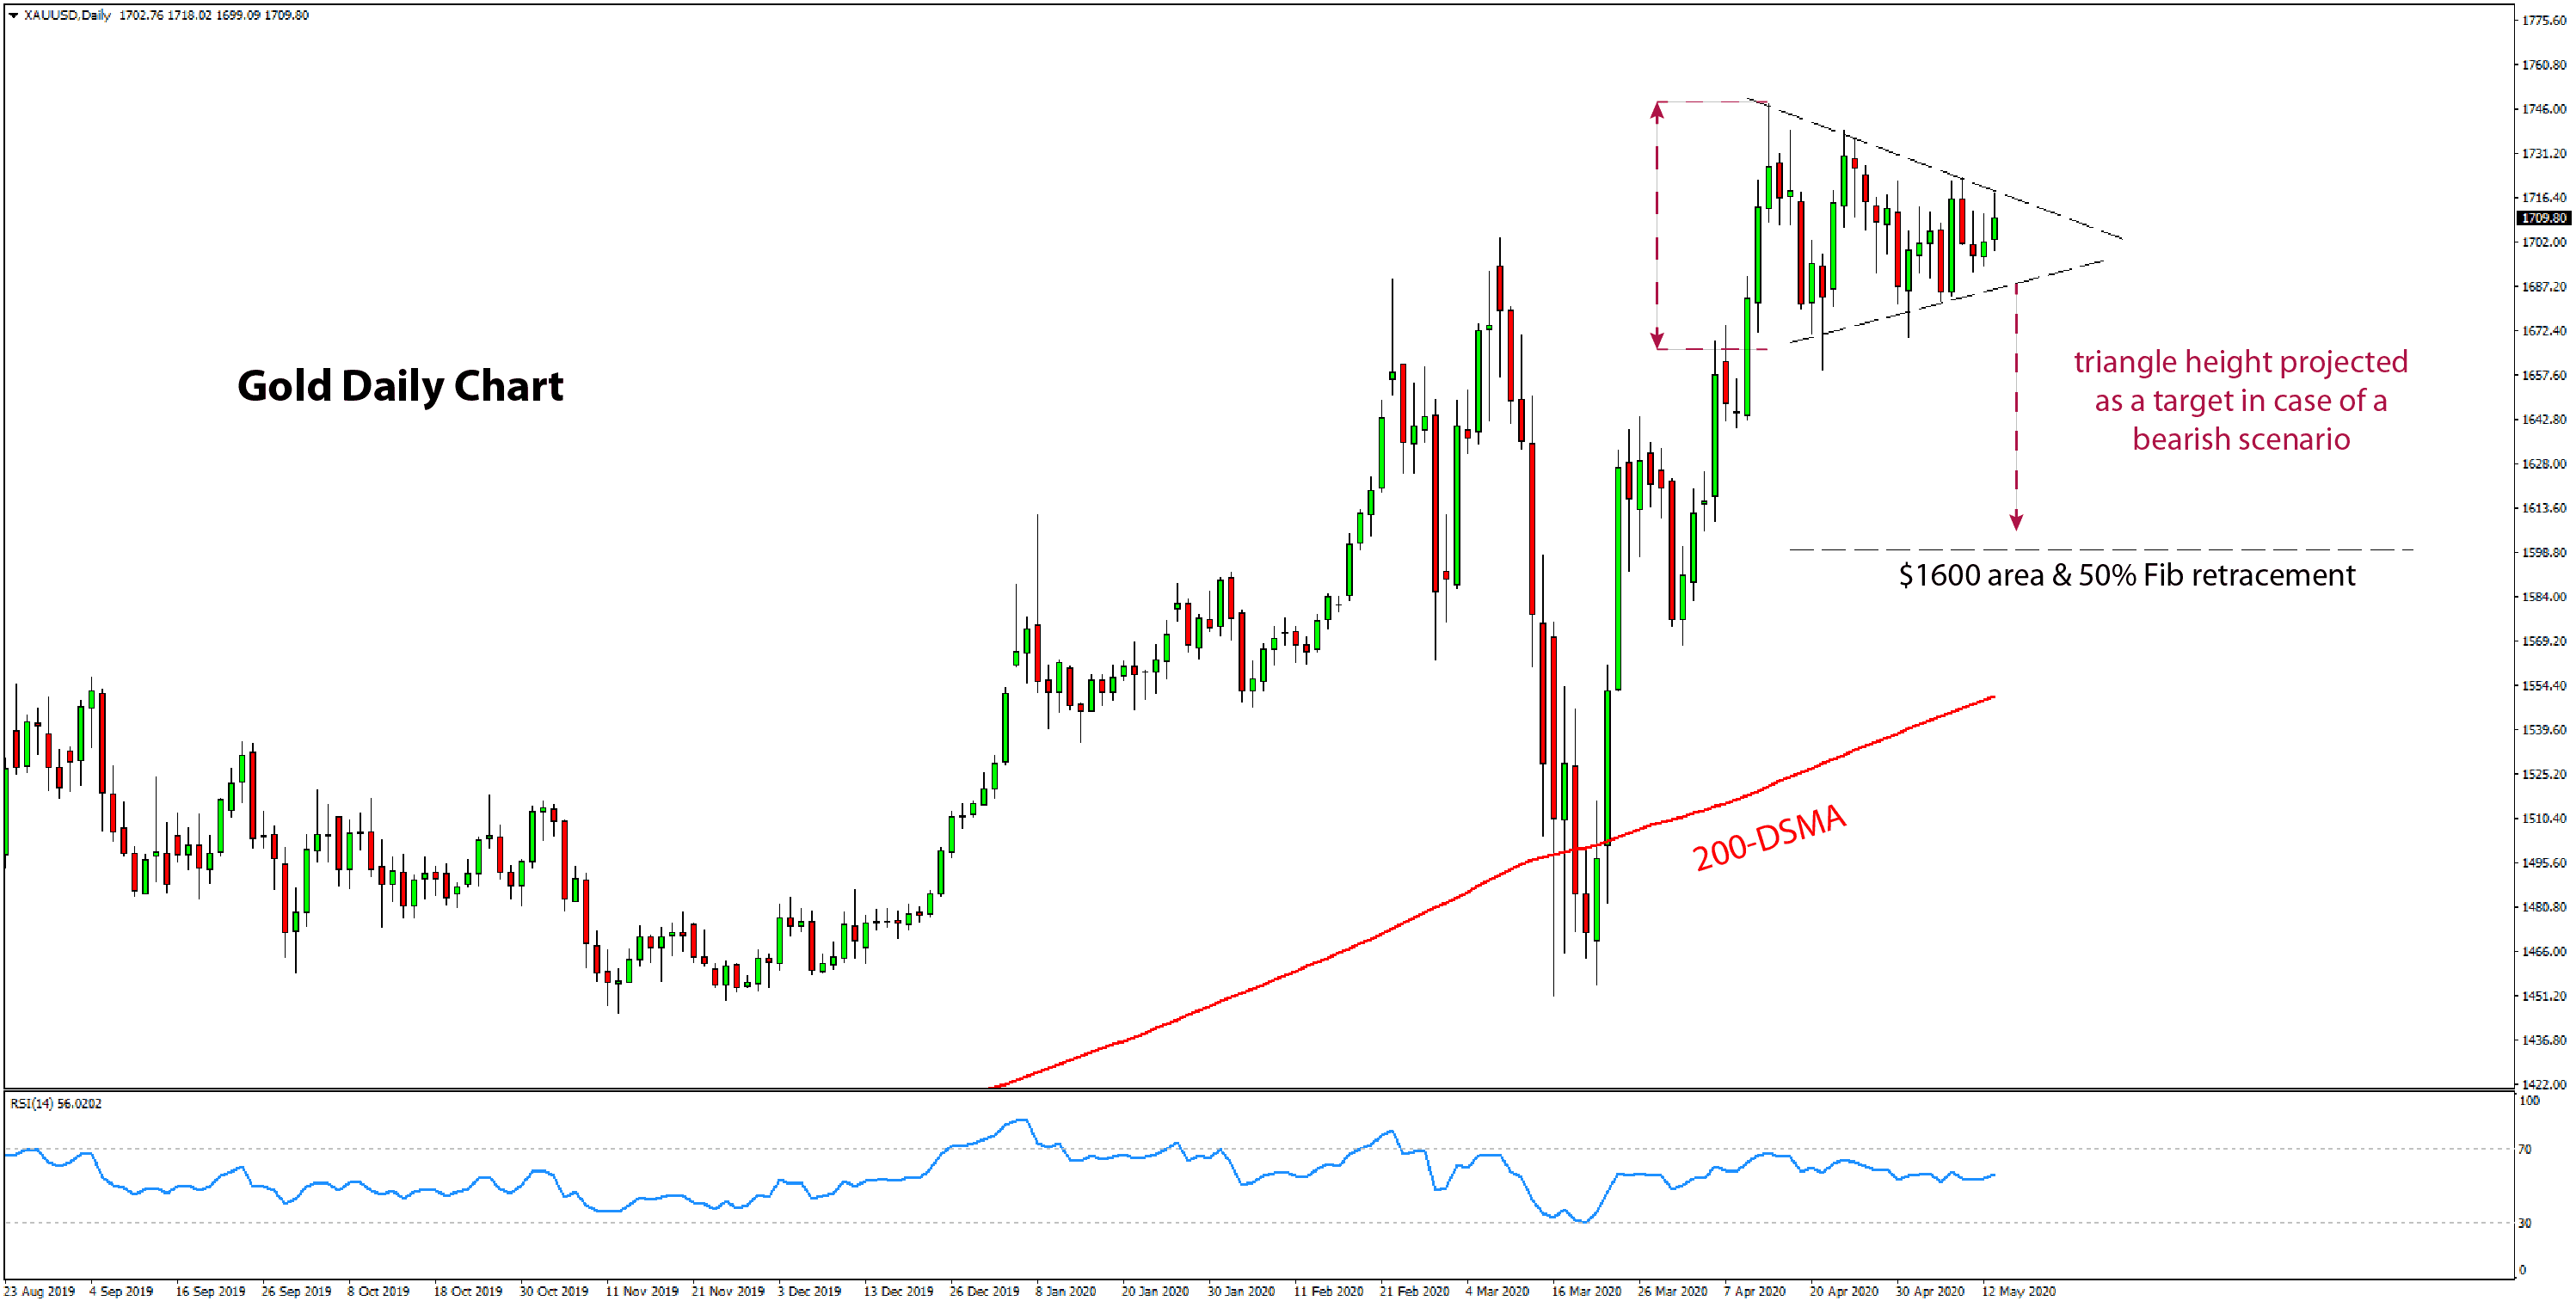
The triangle is more clearly seen on the daily chart. A bearish breakout would likely result in a sharp initial move lower. The projected target of the triangle would be toward the $1600 area. It also coincides with the 50% Fibonacci retracement (see chart).
Further lower, the 200-day moving average (red line) stands at $1551, not far from the weekly support trendline discussed above.
The daily Gold chart with all the key levels is shown below:
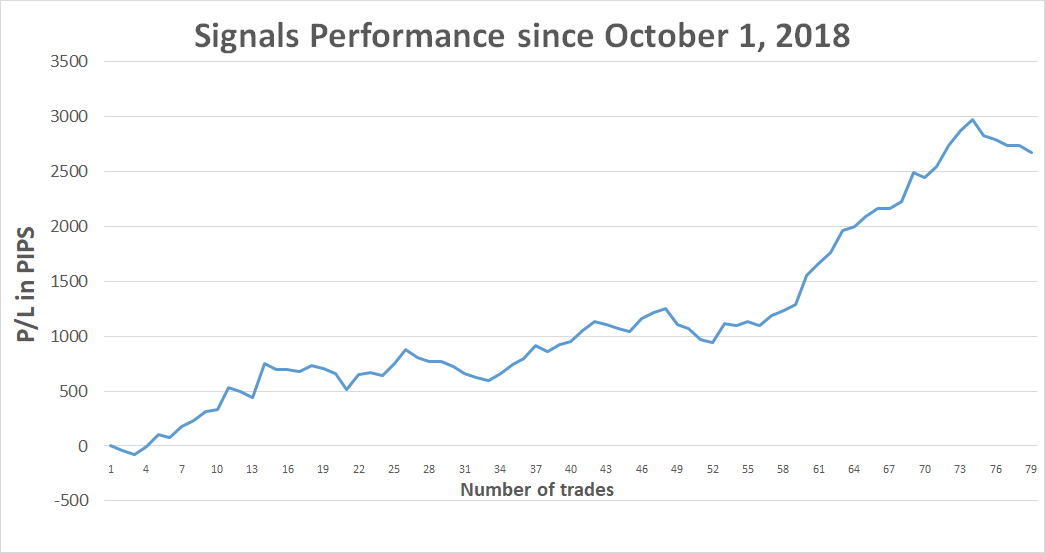
Trade signals from the past week
- April 29 - Short USDJPY from 106.75, moved stop to breakeven; triggered this week = 0 pips
- May 07 - Short GBPUSD from 1.2350, stop taken out at 1.2420 = -70 pips (though GBPUSD today broke the neckline, so the H&S pattern is now activated)
TOTAL: -70 pips in the past week
TOTAL: +2670 pips profit since October 1, 2018
If you have any questions or feedback, don't hesitate to reply to this email.
Thank you!
High Risk Warning: Please note that foreign exchange and other leveraged trading involves significant risk of loss. It is not suitable for all investors and you should make sure you understand the risks involved, seeking independent advice if necessary.
Any opinions, news, research, predictions, analyses, prices or other information contained in this newsletter is provided as general market commentary and does not constitute investment advice. FX Trading Revolution will not accept liability for any loss or damage including, without limitation, to any loss of profit which may arise directly or indirectly from use of or reliance on such information.
|
|
|
|